USD/JPY Trades Above 107
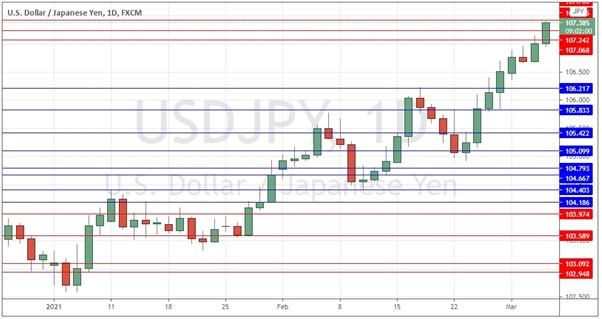
The last two trading days have seen the major currency pair USD/JPY march higher and higher to new multi-month highs. It has gained almost 5% in value over the past two months and is now clearly the most consistently trending Forex currency pair. The break above 107.00 has seen the price trade as high as 107.39 as at the time of writing.
The daily price chart below illustrates the nature and quality of the current move, showing clearly that the price has been advancing in clean and consistent bullish waves.

USD/JPY Daily Chart 2021
Other Currency Pairs Remain Rangebound
Although the size of the move that we have seen over 2021 in this currency pair is hardly large in absolute terms, what is significant about what is going on with the USD/JPY is that other major currency pairs are not breaking to new multi-month highs or lows but are instead trading well within their long-term ranges. The only major exception to this is the EUR/USD currency pair which is currently not very distant from its 50-day low at 1.1952.
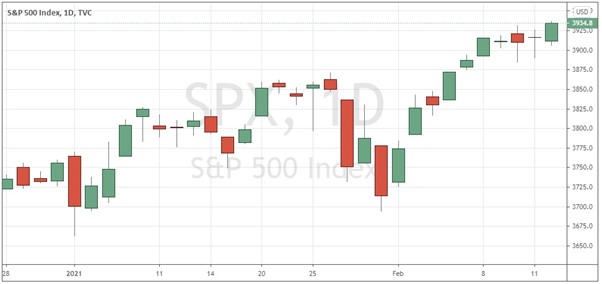
What is causing this relative strength in the USD/JPY? It is quite straightforward. After trending down for many months, the U.S. Dollar – which dominates the Forex market as the world’s largest reserve currency – has reversed direction, and the U.S. Dollar Index is breaking to new highs. It is being pushed on by falls in stock markets and risk-off liquidations, with money flowing into the greenback as the major global safe-haven. At the same time, the Japanese Yen has been weakened as Bank of Japan officials talk more and more about the need for even greater stimulus and quantitative easing to even get close to their official inflation target of 2% - Japanese inflation is running well below that, at an annualized rate of only 0.3%.

S&P 500 Index Daily Chart 2021
What Does USD/JPY Above 107 Mean for Me?
Major currency pairs such as USD/JPY are the subject of heavy speculative interest as they begin to trend strongly. When multi-month highs in the USD/JPY currency pair are reached, there has always been a historical bias in favor of buyers in terms of traders’ positive expectancy. In simple terms, the best chance of profit is on the long side, although a hard stop loss must be used with discipline to make this edge work relatively safely.
It is useful to check the past 20 years or so of historical data, which tells us that when the USD/JPY currency pair makes a daily close at a new 50-day high or low price, and then pulls back against the trend the next day, it was likely to produce a positive expectancy if traded in the direction of the trend over the next day, and over the next several days.
The last 20 years of data show that following this trading strategy with the USD/JPY currency pair would have produced the following results:

Bottom Line
The USD/JPY currency pair is the “hot hand” in today’s Forex market and is breaking to new long-term highs. Following a day of a bearish retracement, the odds based on historical precedent are likely to favor long trades. This could be a great time to look for a long trade in USD/JPY after a bearish dip in the trend begins to reverse back in the direction of the trend. A hard stop loss based upon volatility (the average true range of say the past 15 days) should always be used.
