By: Doug Rosen
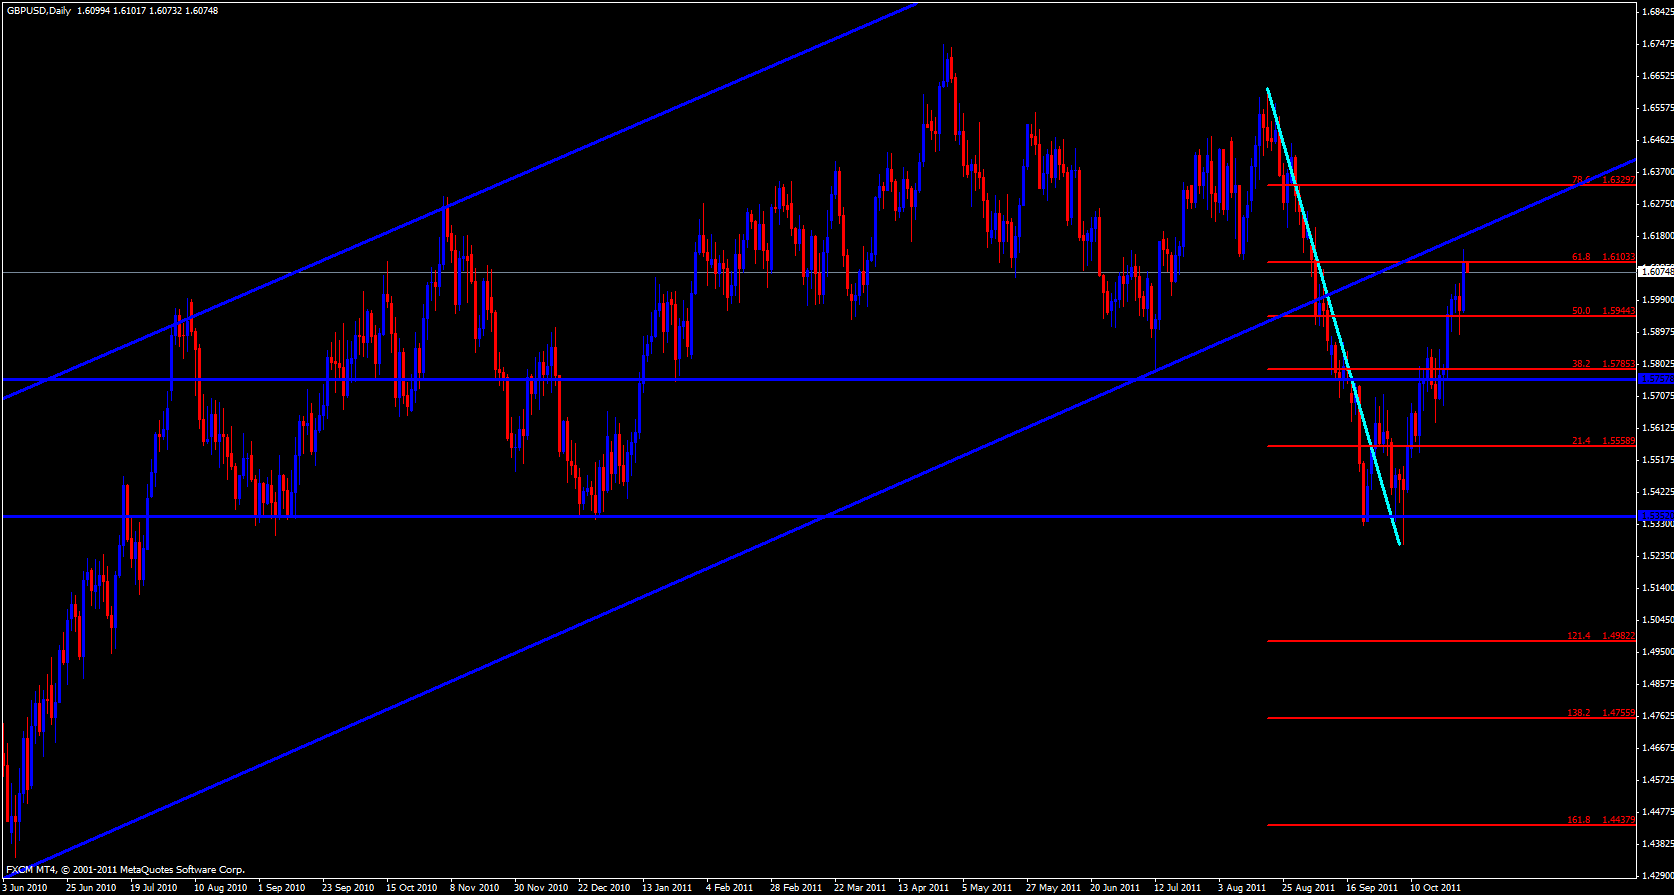
Starting my analysis today on the daily chart it is clear that price has precisely reached the 61.8 fib overlapped with the lower trend line of the price channel price had previously been trapped within.
Price is also spaced a bit from the 5 ema and the stochastic is in the overbought region so I would expect some form of retracement to soon occur.
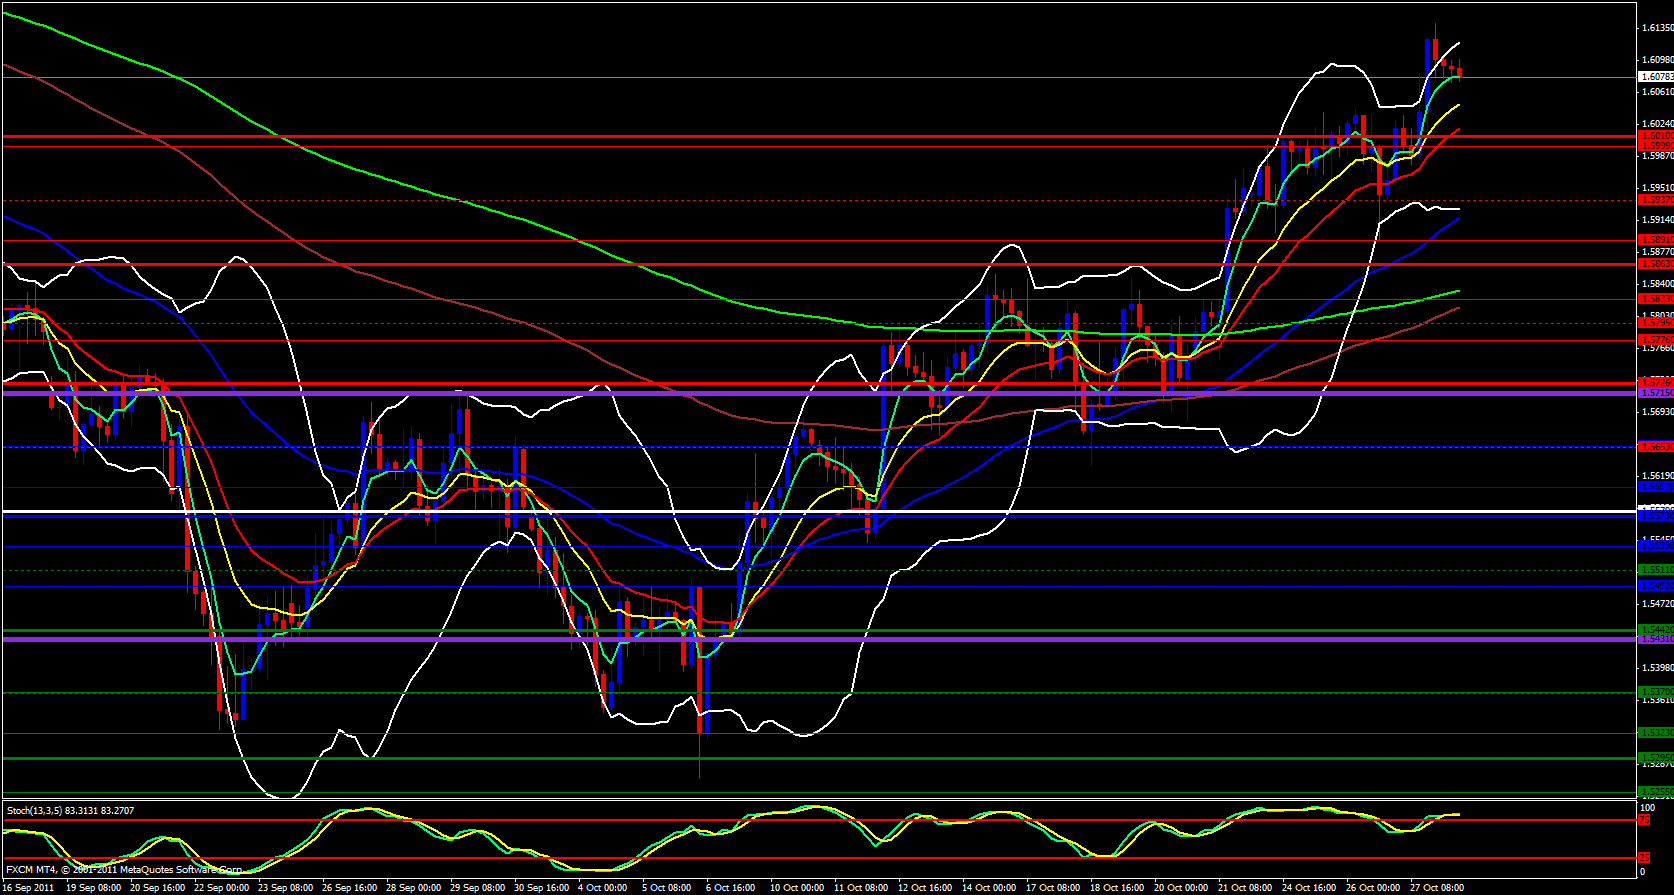
Moving over to the 4 hour monthly pivot chart There are no more pivot levels above, we have busted through all of them. A retracement is expected and the R3 is at 1.6010 which overlaps with the 21 ema. I would watch for price to head to that level then bounce back up.
Moving on to the hourly weekly pivot chart I see that price did bounce off the M4 at 1.6141 and is now hovering around the R1 at 1.6083 and a stochastic that is pointing down. The 5 ema is coming down to the 13 ema and a cross may occur confirming a retracement.
Finally, looking at the 15 minute daily pivot point chart price is in a tight range just above the central pivot point at 1.6064 with narrow Bollinger bands and a stochastic pointing down. I will watch to see if price heads to the central pivot which is at a fib level with he 144 ema not far below and see if there is a bounce. If I seee evidence that there will be a bounce I would look to go long, otherwise, if price breaches the central pivot point I would watch for the retest then a possible short.


