By: Doug Rosen
See how this EUR/USD technical analysis was implemented on a binary actions platform.
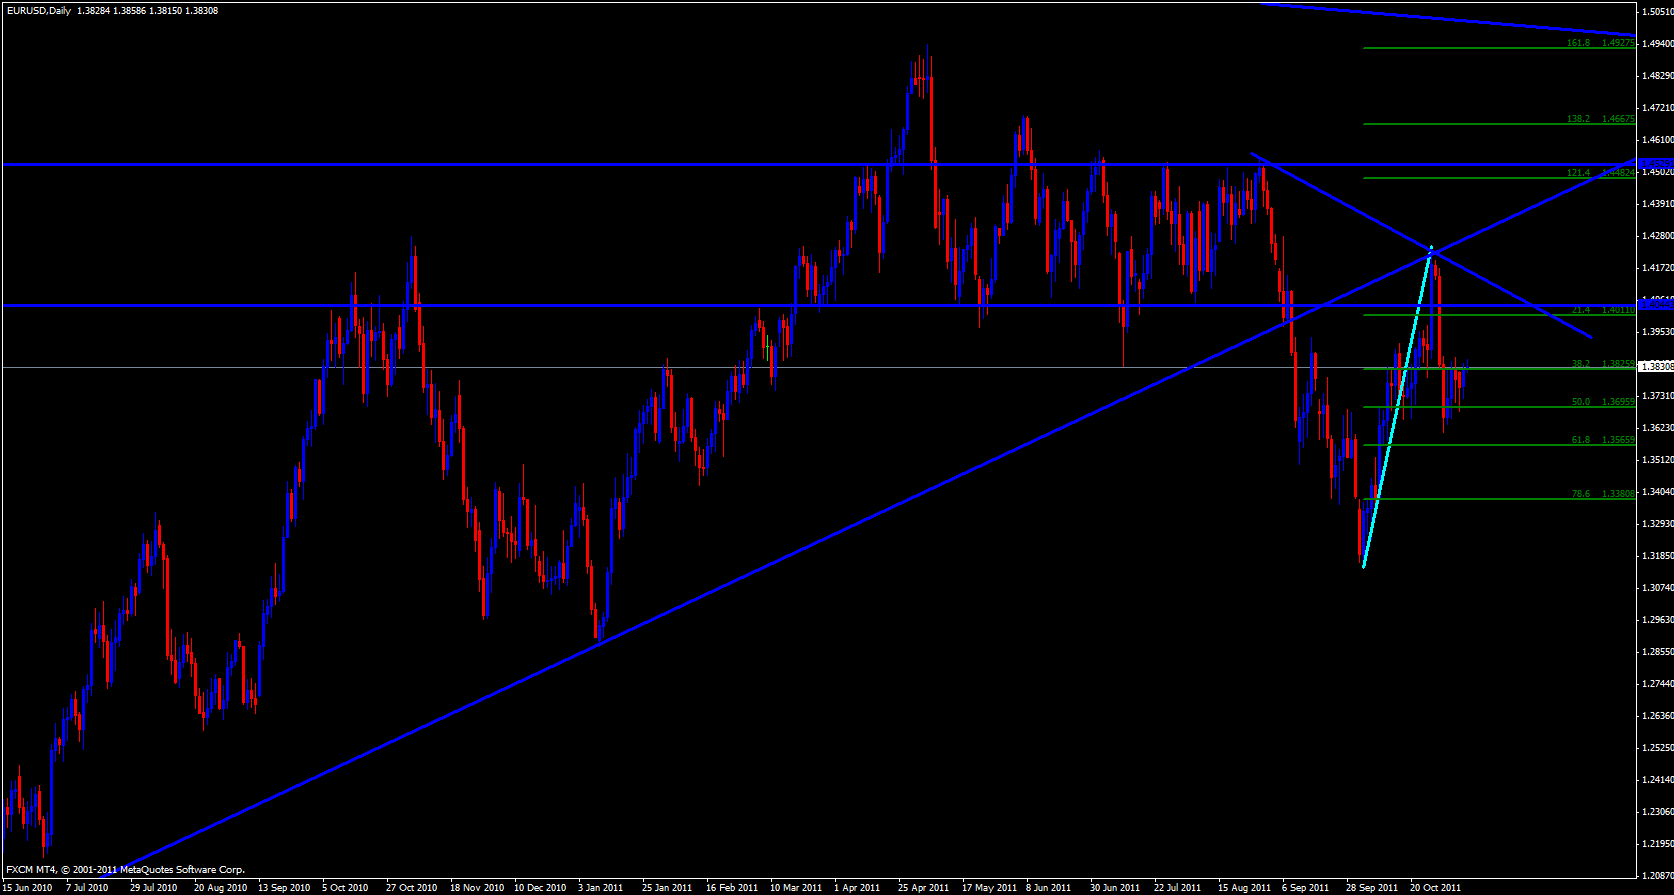
On the daily time frame I can see that yesterday this pair made a higher low and a slightly higher high and price seems to be rising from the recent fib it has made to the upside. The stochastics is at the bottom of the trade zone crossing up and price is just above the ema's. One thing I cannot ignore is the appearance of the double top the daily candles have developed.
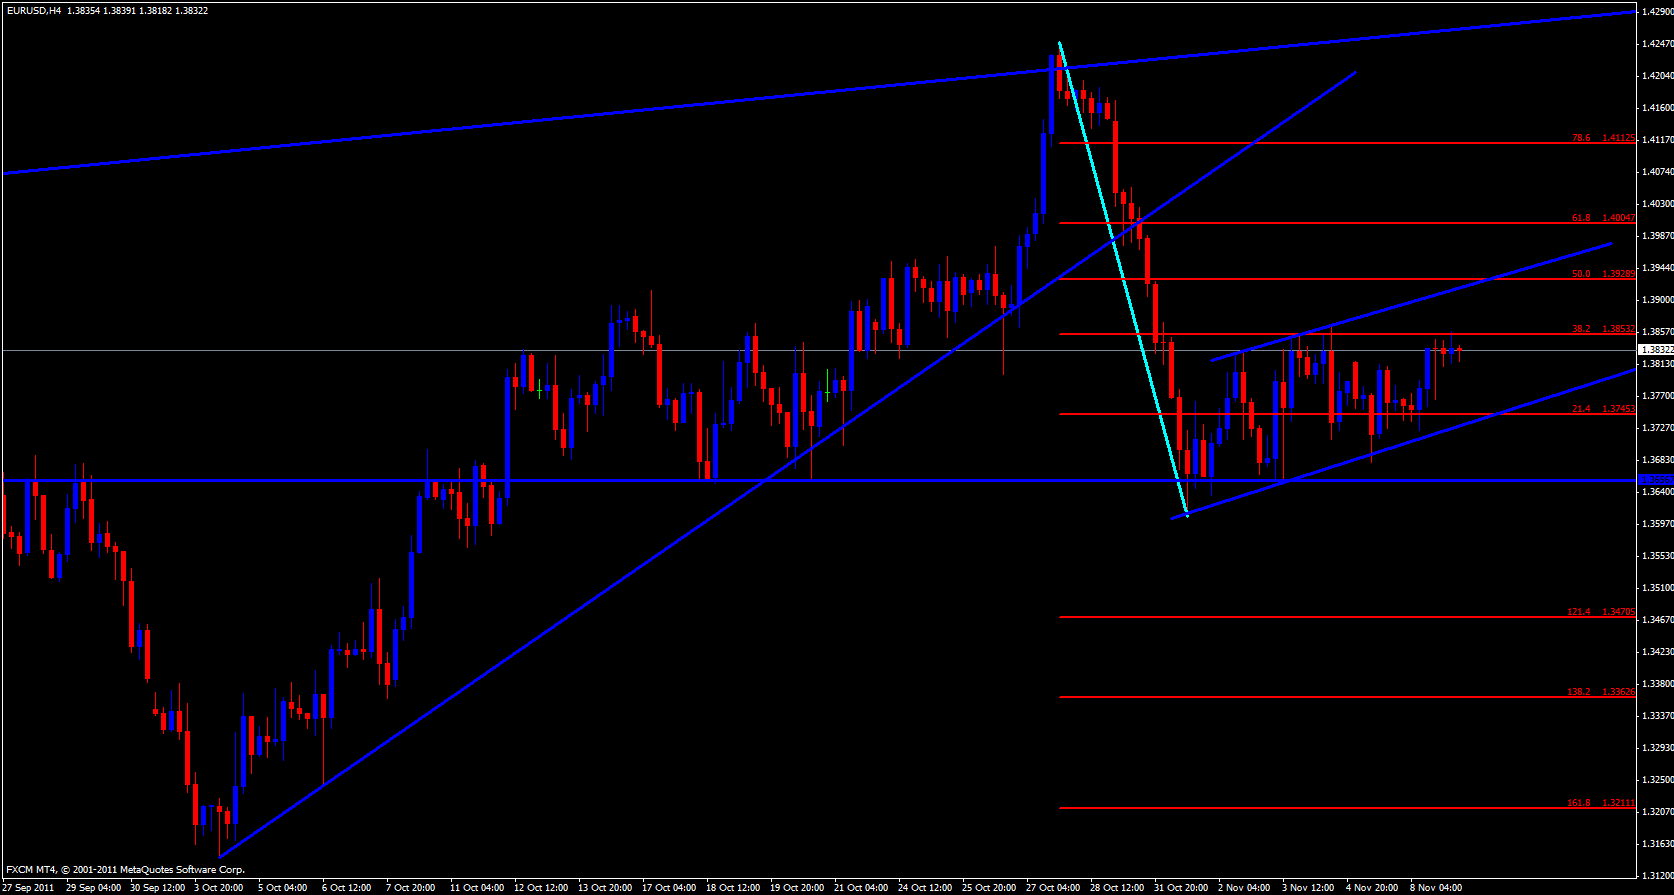
Moving on to the 4 hour chart I see some ema crossovers to the upside and price is currently above the 5 ema and the stochastics is pointing up, however, it is in the overbought zone. Price is also above the monthly central pivot point at 1.3749 as well as the weekly central pivot at 1.3758 and the weekly M3 at 1.3820, it is even just above the weekly M3 pivot and also the daily central pivot at 1.3800 but approaching the daily M3 at 1.3839 with yesterdays high just a few pips above that at 1.3846.
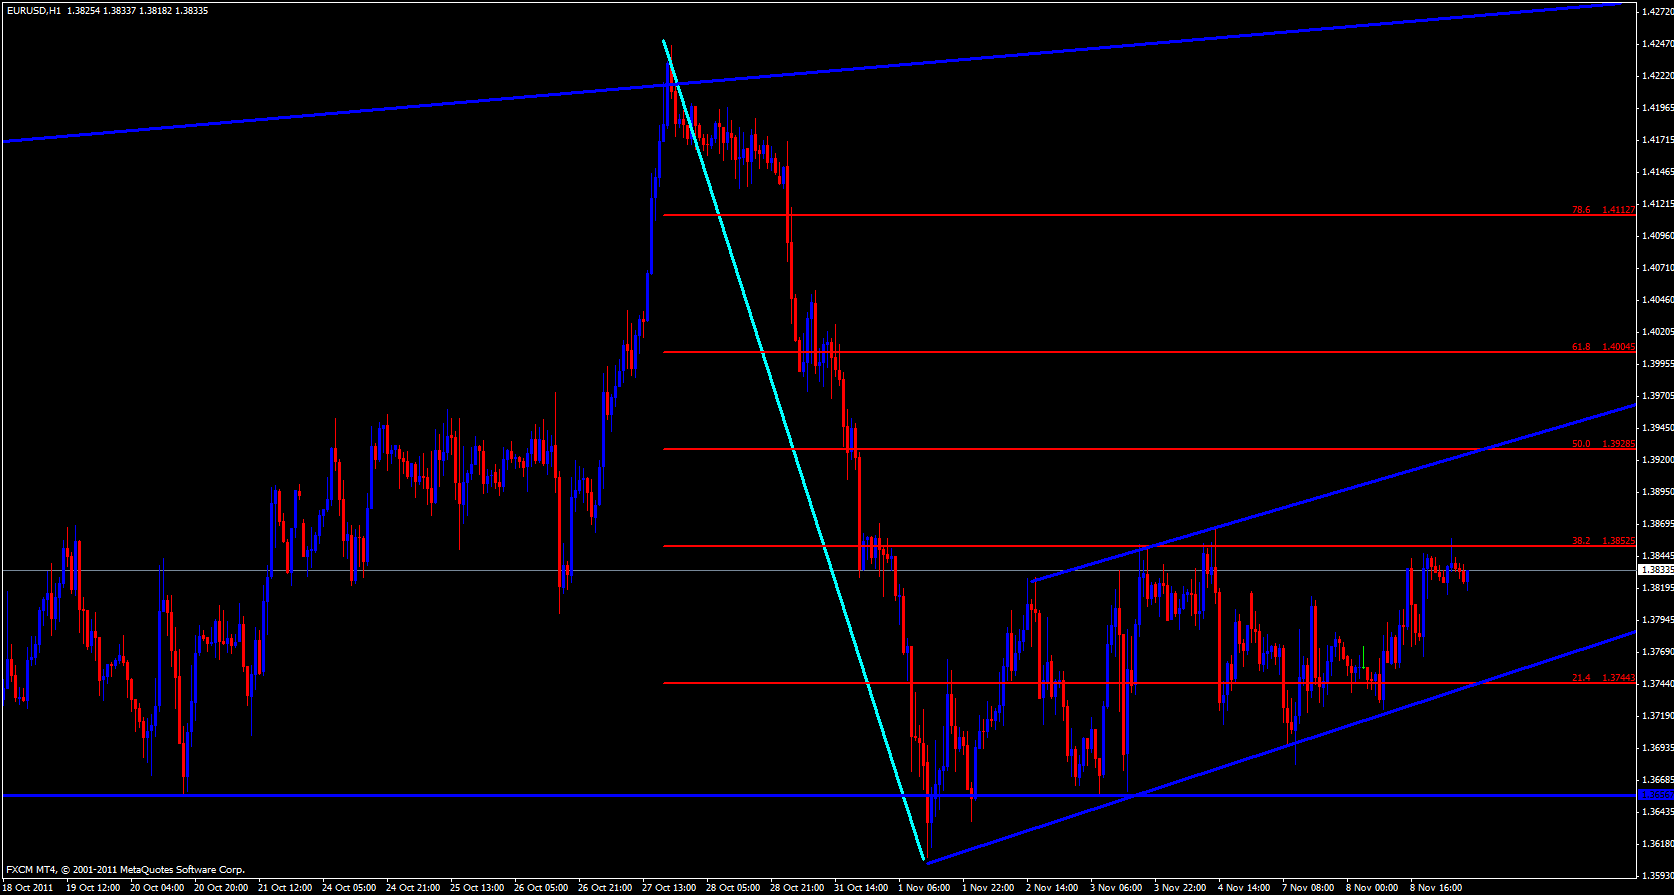
On the hourly time frame price is just above the 13 ema which has crossed above the weekly M3 and the next area of resistance I can see is last week's high at 1.3868 and the weekly R1 at 1.3882.
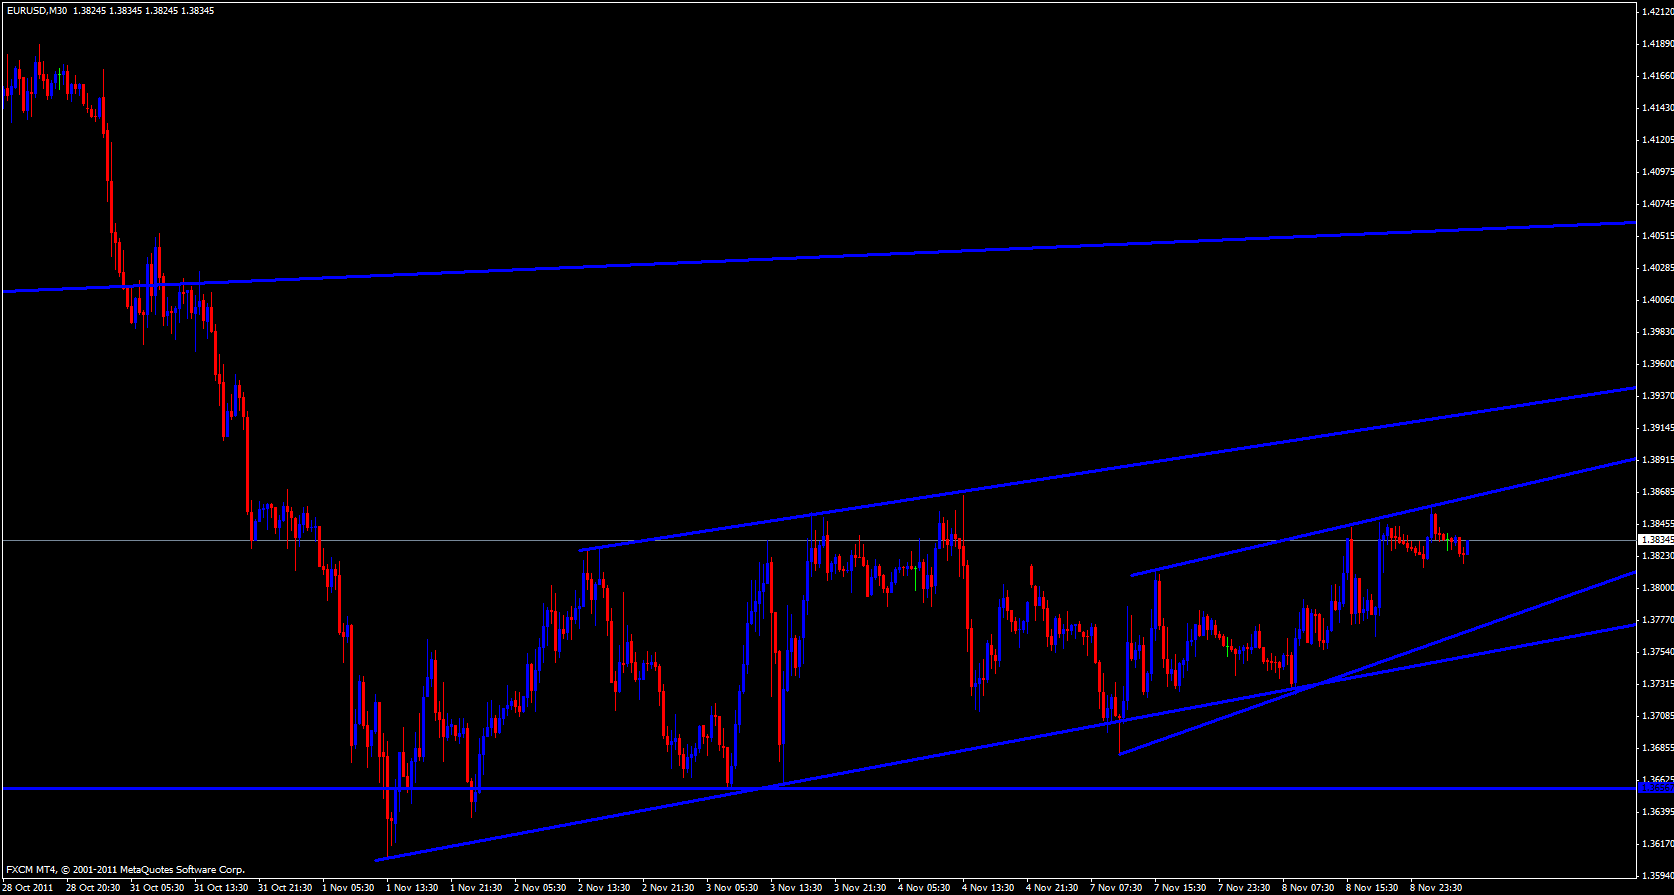
Finally, I look to my 15 minute chart and see that price has been making a series of higher highs and higher lows and technically there is no reason for this to trend to end. At the time I am writing this analysis the stochastics is in the oversold zone and price is just above the 15 minute 55 ema. At this time and regardless at which time frame you are viewing price appears to be confined in a price channel and it is in the center of the channels, in fact, we have price channels in the higher time frames with lower time frame channels within them. I would watch out for price around 1.3865 to see if it breaks and if it does, then I expect it to go to 1.3930 area.


