By: Doug Rosen
The volatility for the EUR/GBP picked up just a bit yesterday. The range was 42 pips. In my recent analysis for this pair a few days ago I pointed out that the weekly candle made touchdown with the mighty 233 ema as I had predicted previously and you can always be sure that when price hits touches the 233 ema on any timeframe there will almost always be a reactionary bounce of some sort to some degree; barring news related events. The reason for that is profit taking. Most analysts go by the 200 ema but I adjusted mine to 233 since 233 is a fib value and all of you that read my daily analysis by now should know my conviction of Fibonacci. I am a technical trader first and foremost and my entire methodology is based purely on hardcore mathematics. Sure, the market is moved by fundamentals and technical's just put you in the trade but anything fundamentally related will always show up instantly in the charts. In fact, in many cases the technical's will overcome the fundamentals in that when News Announcements move the market in a particular direction and profit taking levels are reached such as extreme pivot levels or Fib Extensions.
Back to the analysis at hand, so when price makes contact with a 233 ema profit taking may occur but this does not mean there will be a reversal, just a retracement, and once all the limit orders are triggered, they are gone so when price hits the 233 ema again it should keep on going through. So now price is falling towards the 233 ema once again, however, price has also extended itself outside the lower Bollinger band and the new weekly candle has not yet made contact with the weekly 5 ema which is inevitable.
On the daily timeframe it is obvious that price tried to make a fib but it wasn't a full fib. Daily price did not even make it to the 13 ema. Remember, we are still caught in a holiday week and thinner than usual market conditions do exist which means not a lot of follow through in the market. Currently, the new daily candle is below the 5 ema.
On the 4 hour timeframe I do see some hints on a possible change of trend. You need to be aware of these subtle signs all the time. First, a double bottom, maybe we will make a higher low. Lets watch for a 1-2-3 pattern.
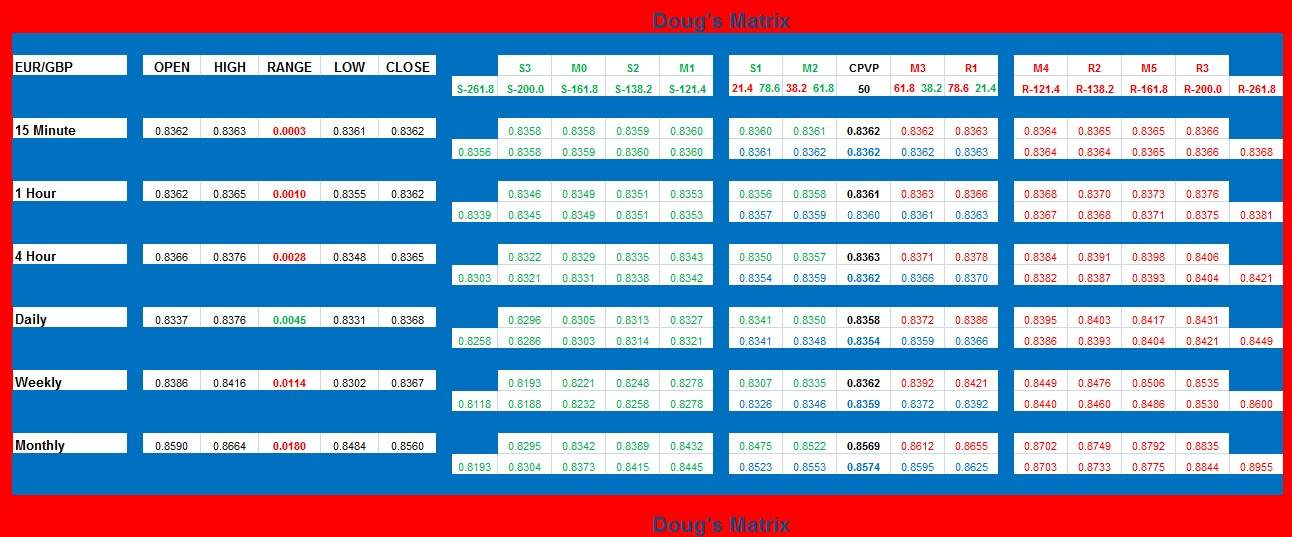
At this time, on the hourly timeframe price is in a range between .8335 which happens to be the weekly M2 pivot and .8346 which is a fib of last weeks range (see Doug's Matrix).
The lower Bollinger band is closing in to the upside and pointing North so we will watch for a series of higher highs and higher lows on the lower timeframes. Breaks above .8365 with a retest is bullish and a break below .8300 is bearish.


