By: Doug Rosen
Yesterday's very bullish day for the EUR/USD was very surprising to me since at the time I was writing my analysis it was in a very, very tight range and the previous day's volume was only half of what it normally is but yesterday's price action made up for all that since yesterday's range was around 140 pips, 20 pips more than the average day for this pair. In Forex there is all sorts of surprises.
So yesterday's bullish price action moved the weekly candle up quite a bit and closer to the weekly 5 ema but not quite enough. I think the weekly candle has to continue to rise and make contact with the weekly 5 ema so it can continue to drop. Doesn't have to but technically this is what should happen. On top of that, the weekly stochastics is in the oversold zone.
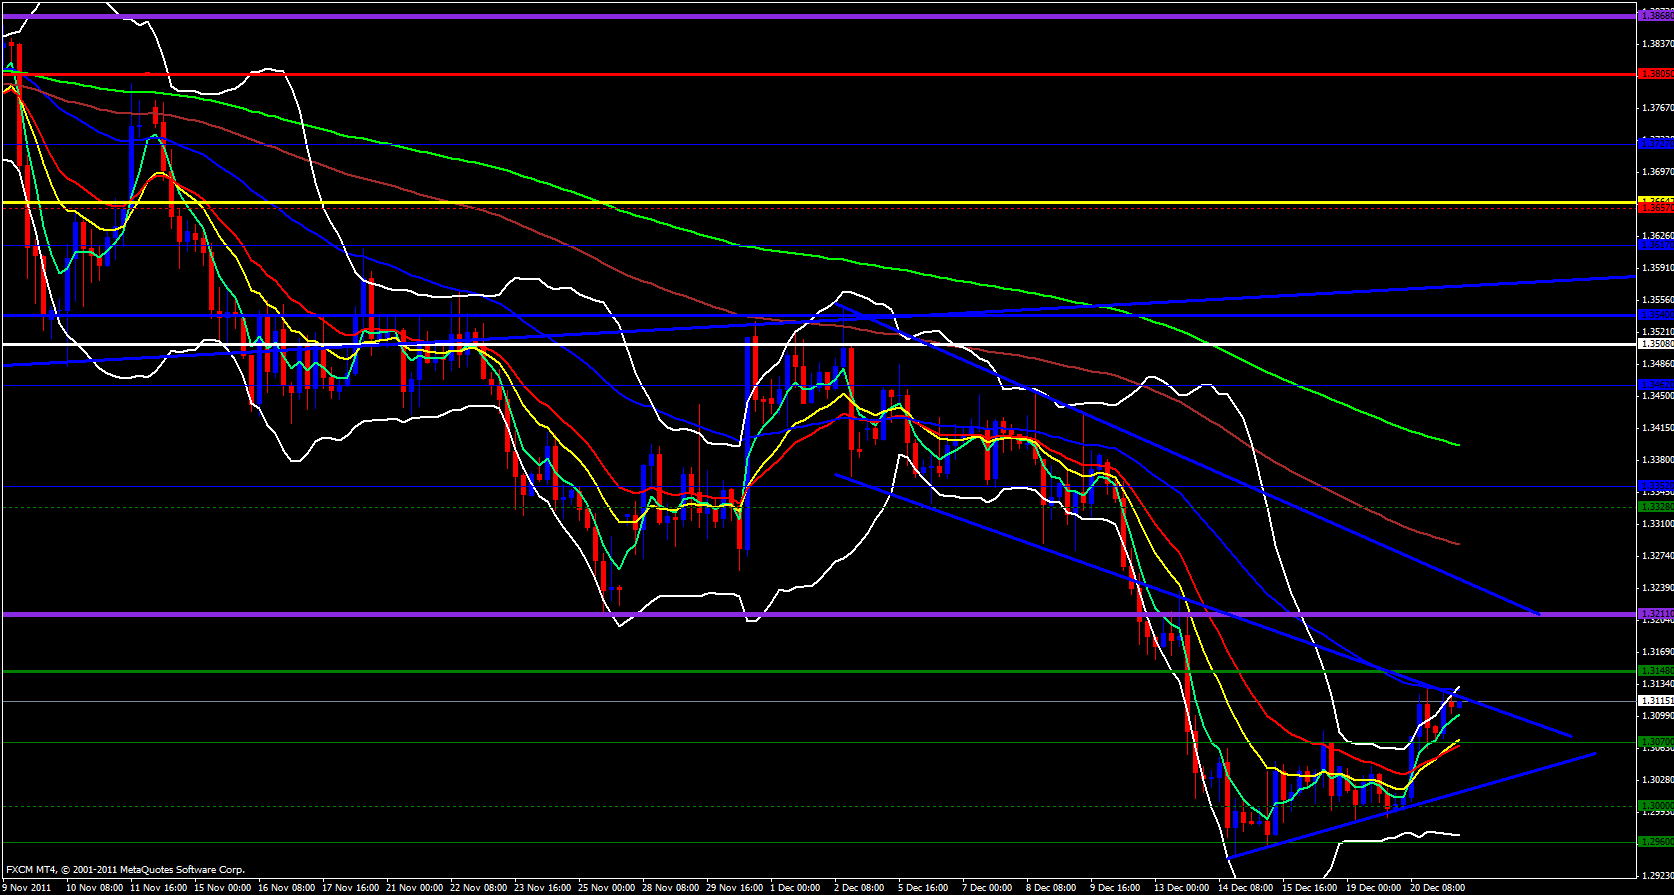
On the daily time frame the stochastics is also in the oversold zone and the 5 ema has been positioned below the daily candle and price is trying to ride the 5 up, but we still haven't reached the 38.2 price level yet which is overlapped with the daily 13 ema and price is just coming up to resistance in that same zone around 1.3156 - 1.3176 region that was support prior to being broken and will probably act as resistance and be a tough nut to crack so we will have to watch what will happen. A move up however, to the 50.0 fib level of the recent swing down at 1.3247 which is overlapped with the 21 ema is quite plausible and it overlaps with the weekly 5 ema.
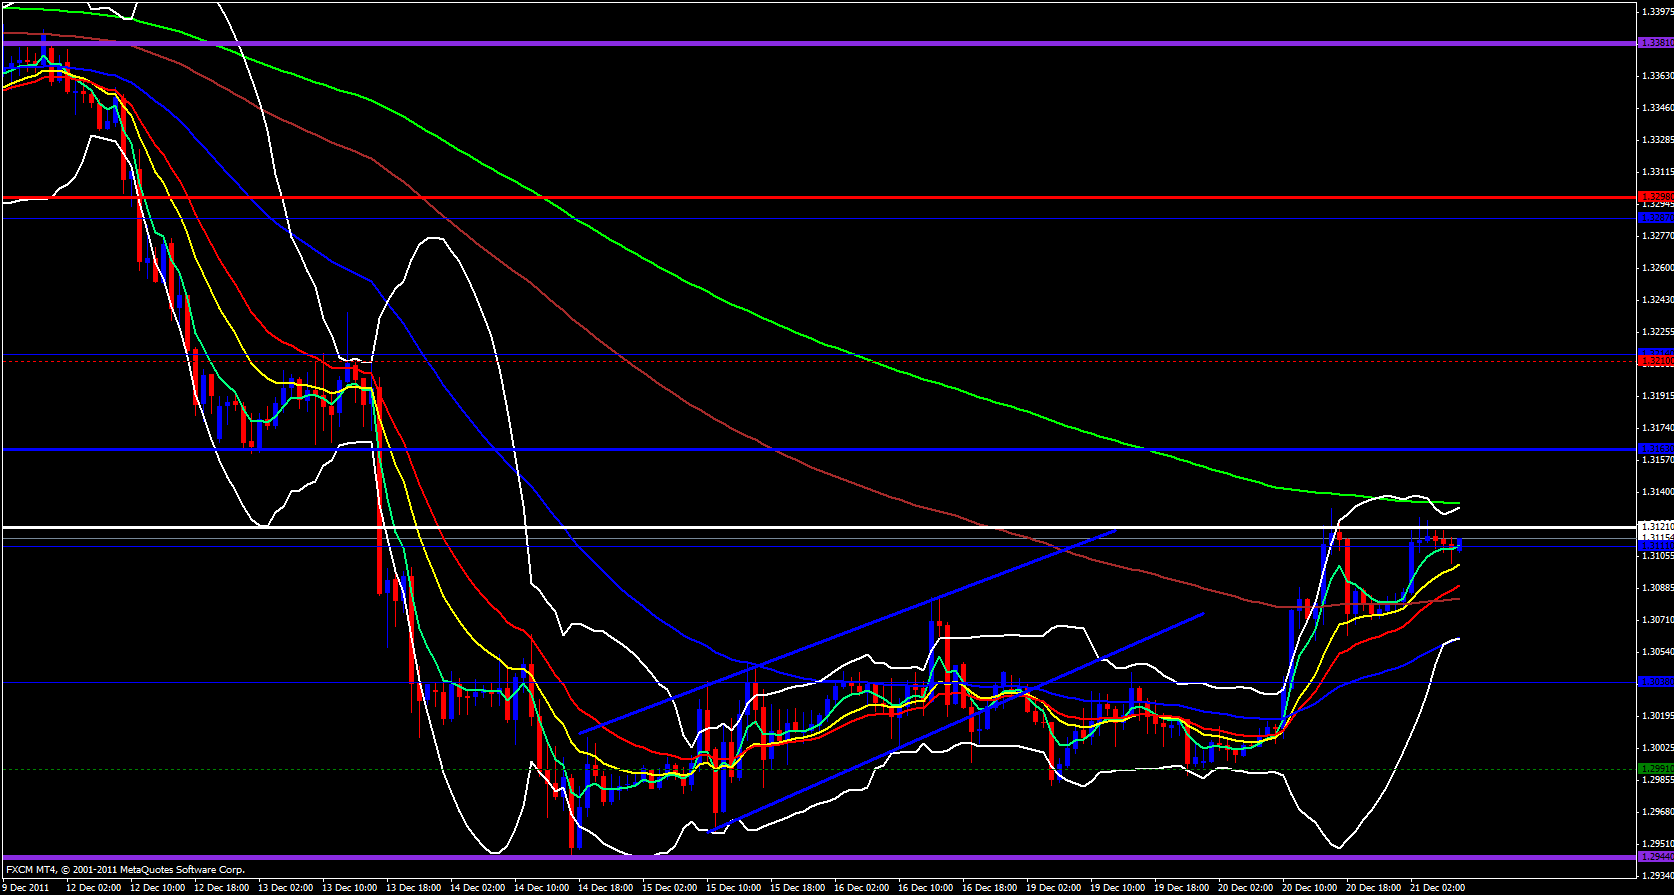
On the 4 hour time frame I have price in yet another triangle price trap and price is approaching the upper line of the triangle while the 5 ema is just below price with an upper Bollinger band opened and pointing up. The only thing that stands int he way is the 4 hour 55 ema which i expect to be broken. The monthly S1 pivot is not too far above that at 1.3148 and this will add to the fight up. So if price breaks the 1.3150 level, I will wait for a retest and take a long. Price is just below the weekly central pivot at 1.3121 and just above that is the hourly 233 ema so all this could give price a very difficult time rising.
The hourly 144 ema is below at 1.3083 so a break below 1.3080 and down to the 55 ema at 1.3060 should cause a bounce back up that fibs and is overlapped with the 144 could send price down.
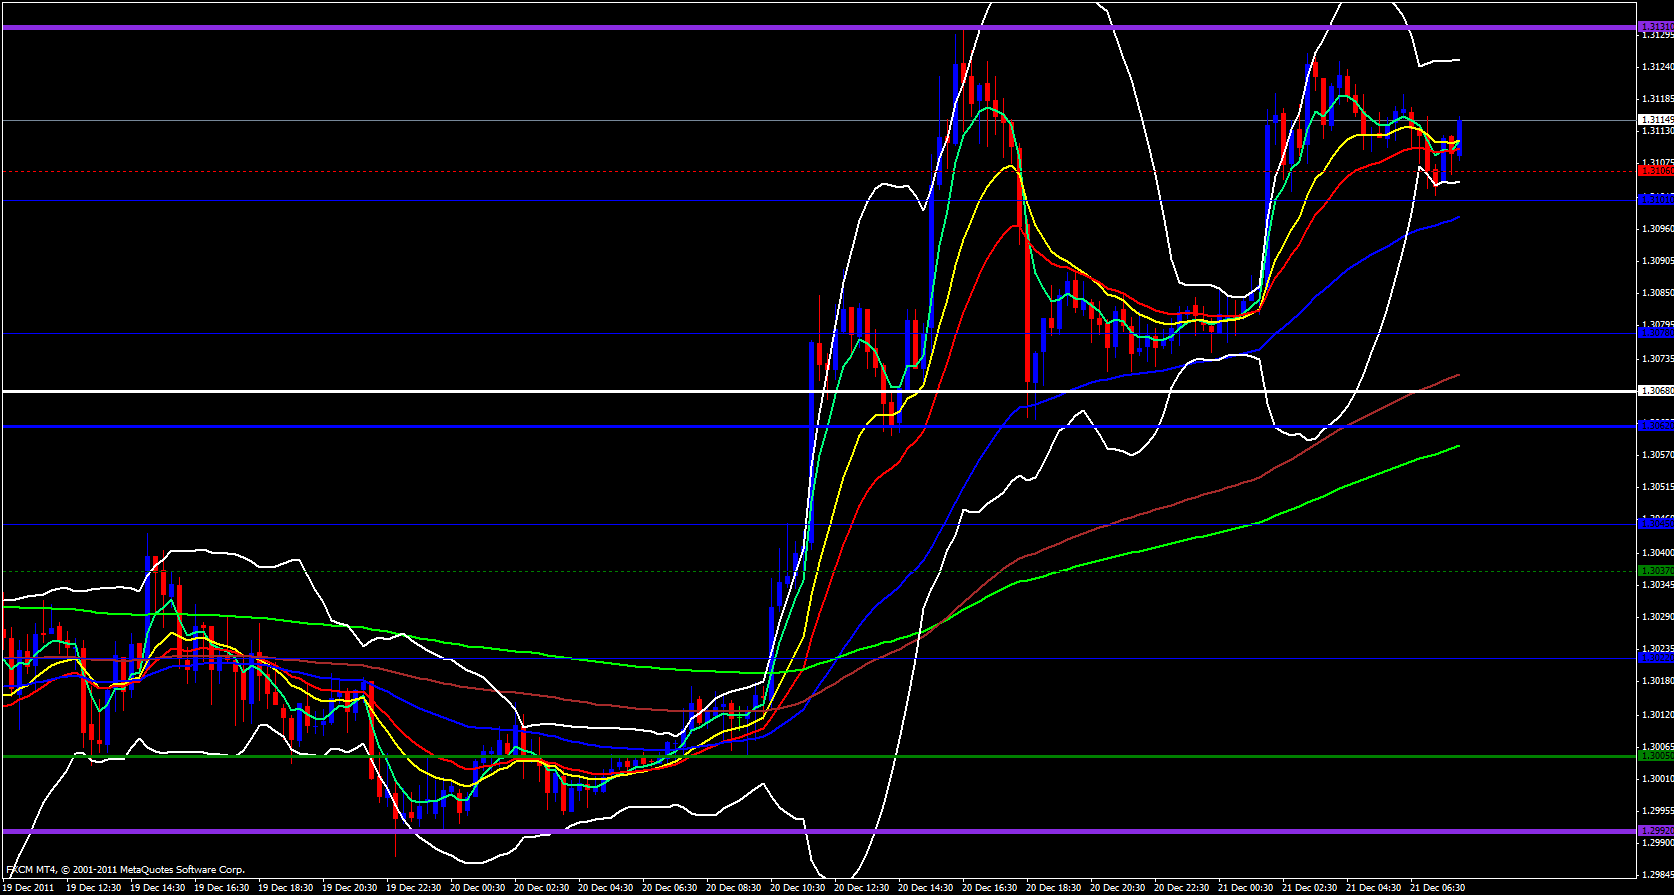
On the 15 minute time frame price still looks bullish and above the ema's. If price can break above 1.3135 it will be a break above yesterday's high and further upside continuation will be expected.


