By: Doug Rosen
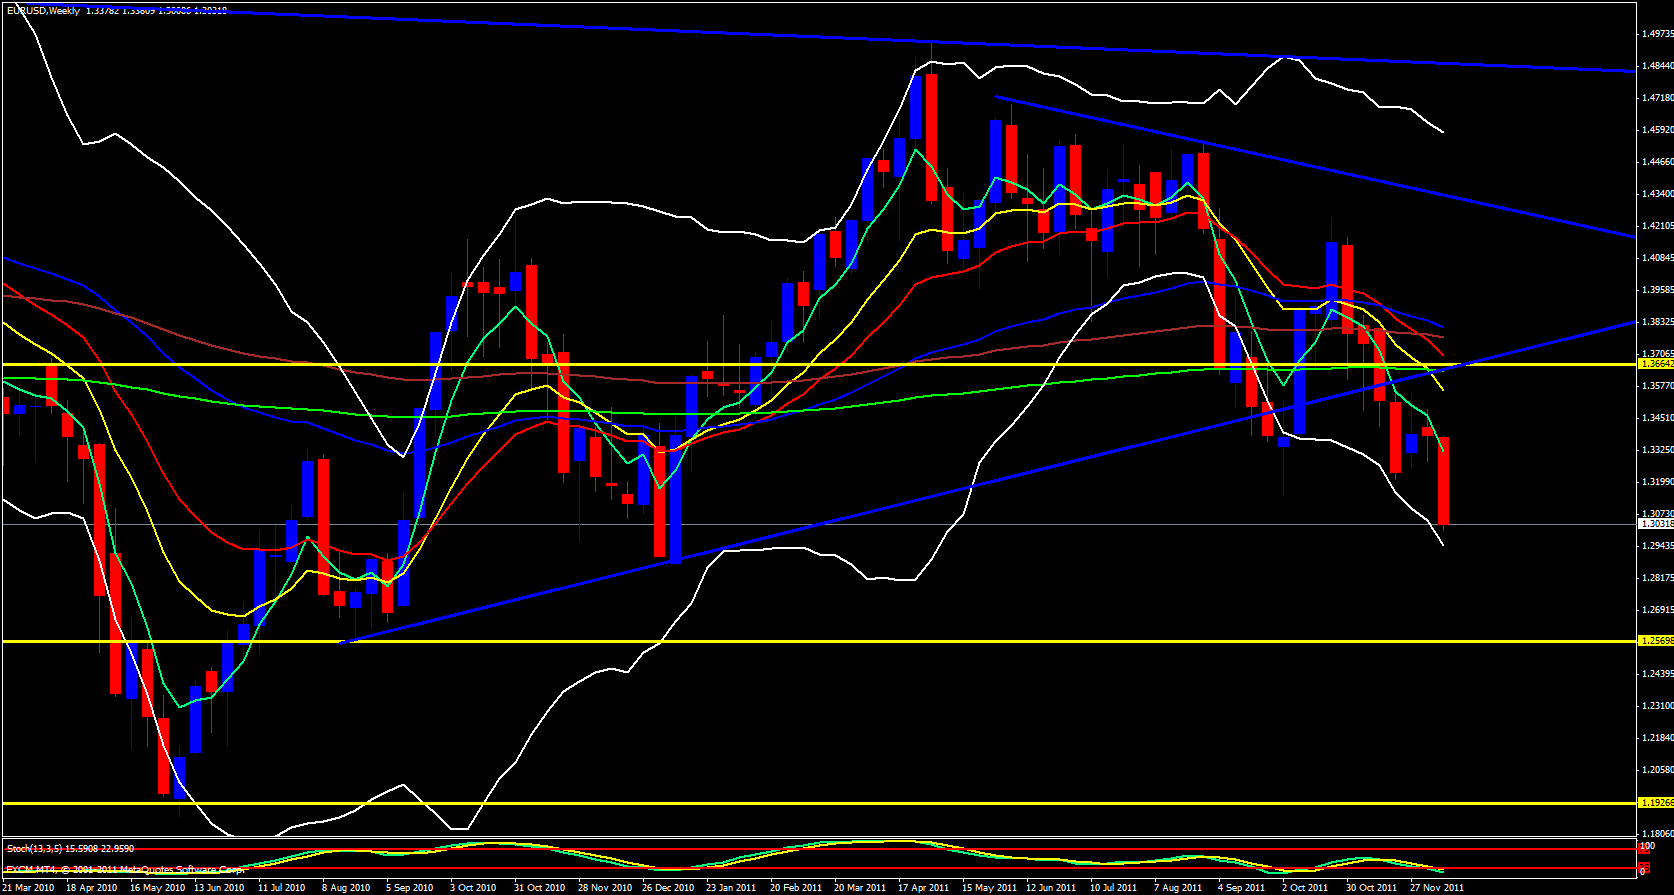
I will start out my analysis for the EUR/USD on the weekly time frame. I want to point out that after yet another very bearish move yesterday for this pair price is taken even further down away from the 5 ema but not it has touched the lower Bollinger band which could be the early heads up that price may soon snap back up to make contact with the 5 ema. The stochastics is also in the oversold zone.
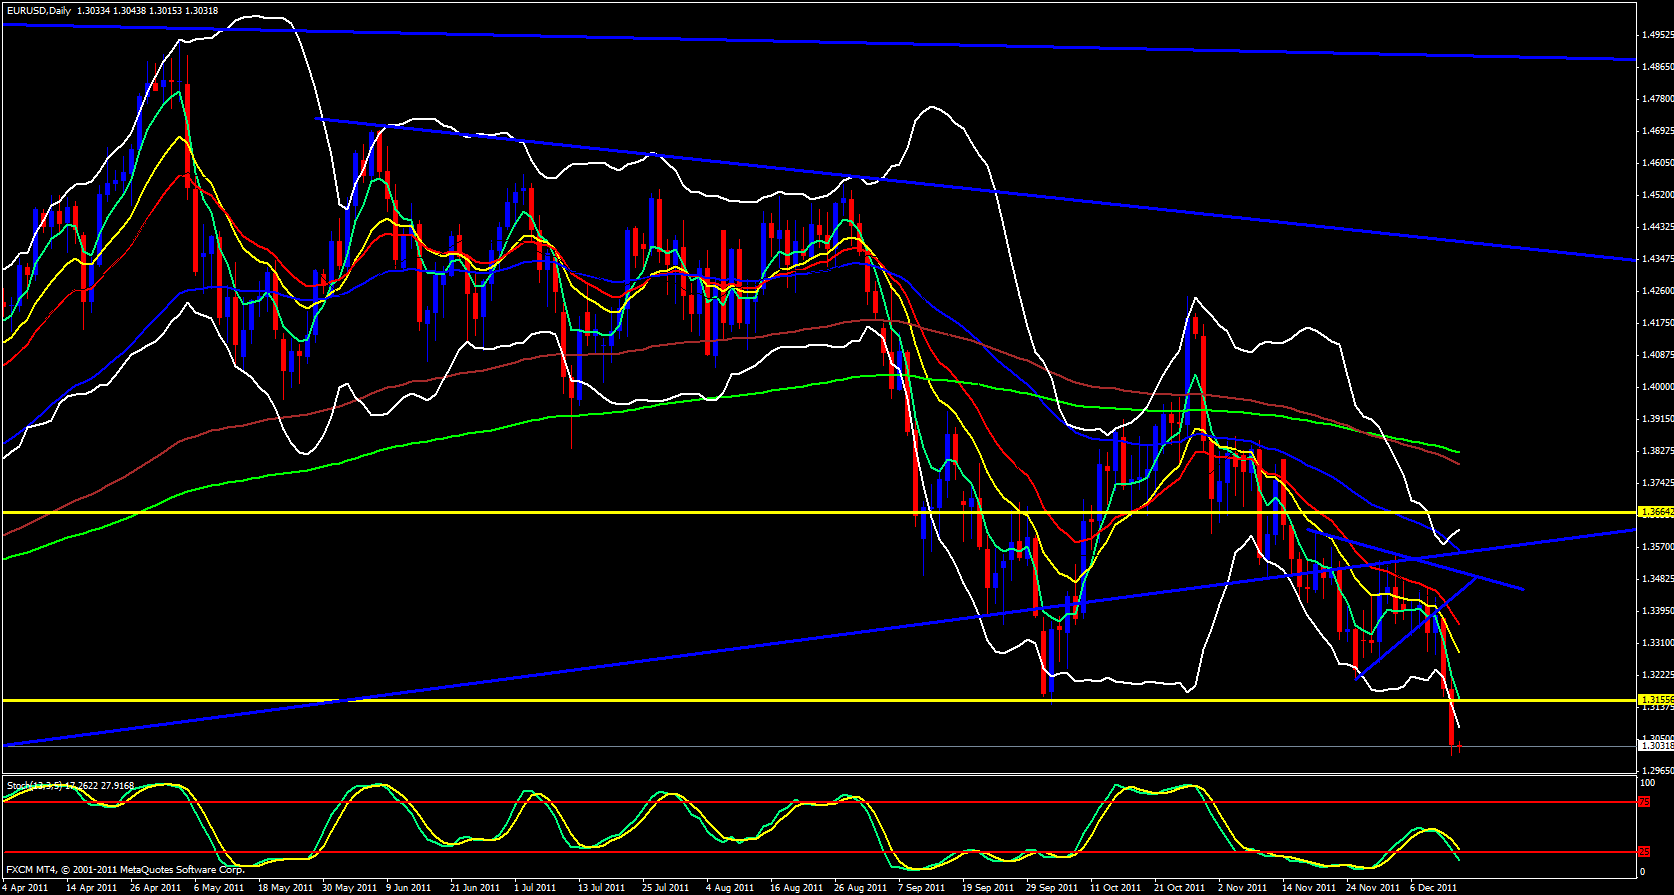
On the daily time frame the daily candle is way outside below the lower Bollinger band and it is spaced away from the 5 ema and the stochastics for this time frame is also in the oversold zone.
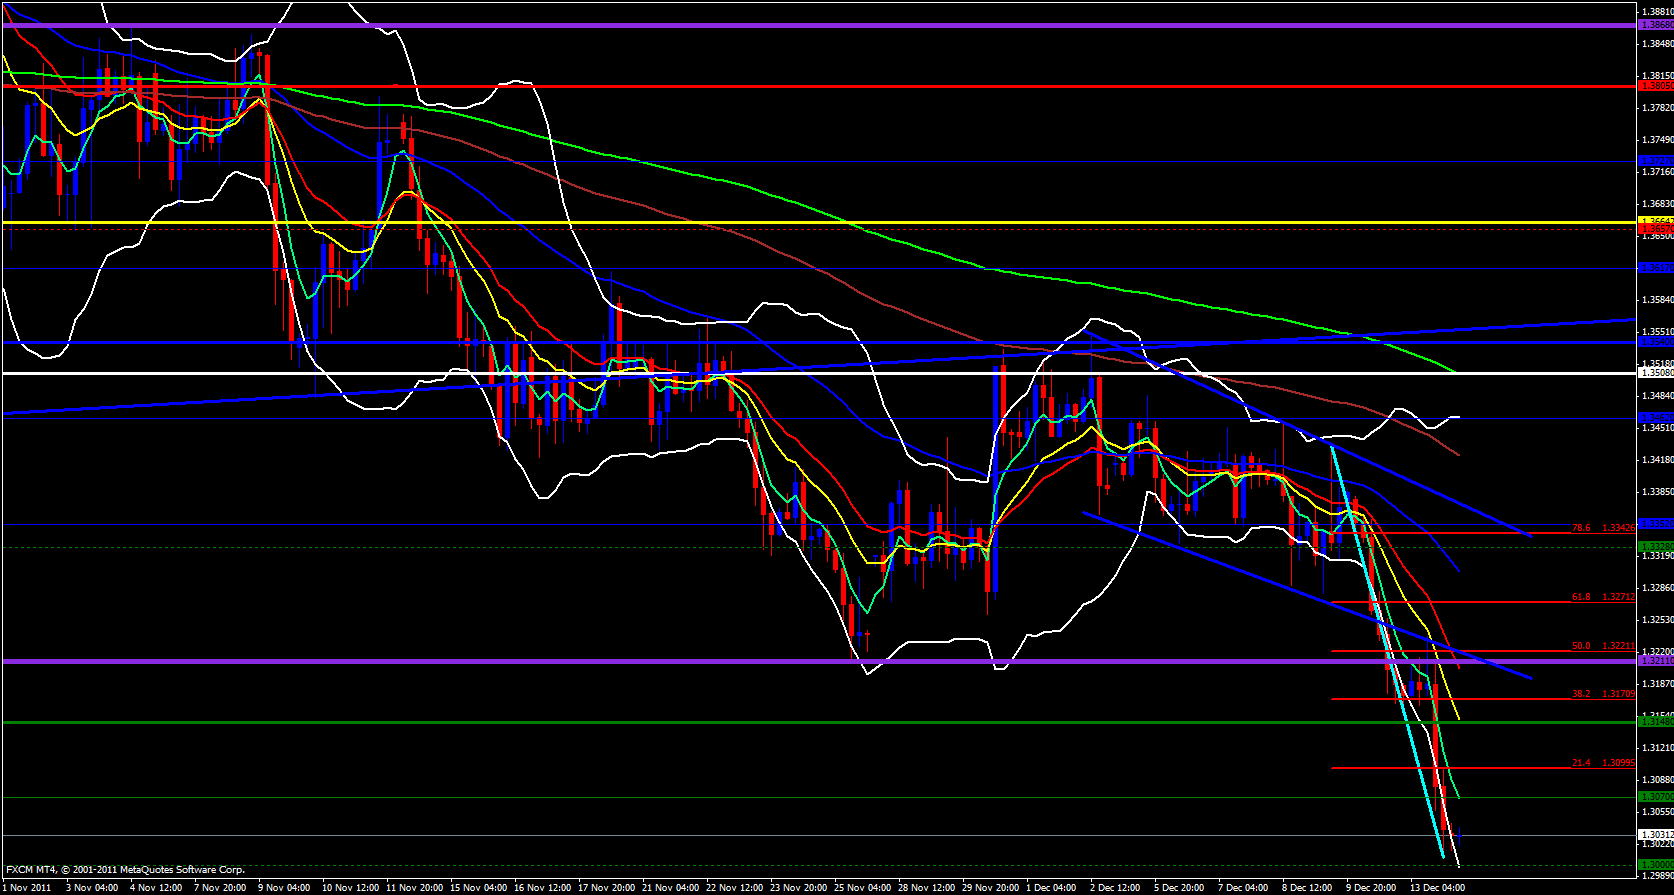
On the 4 hour time frame same story, way below the 5 ema and just coming of the lower Bollinger band. Price is also just above the monthly M1 pivot at 1.30 and on the weekly pivots price is beyond the S3 and today price is below the daily central pivot point but just above the daily M2 pivot at 1.3021 within a tight 15 minute Bollinger band squeeze that generally compresses price and causes it to take off under pressure in either direction.
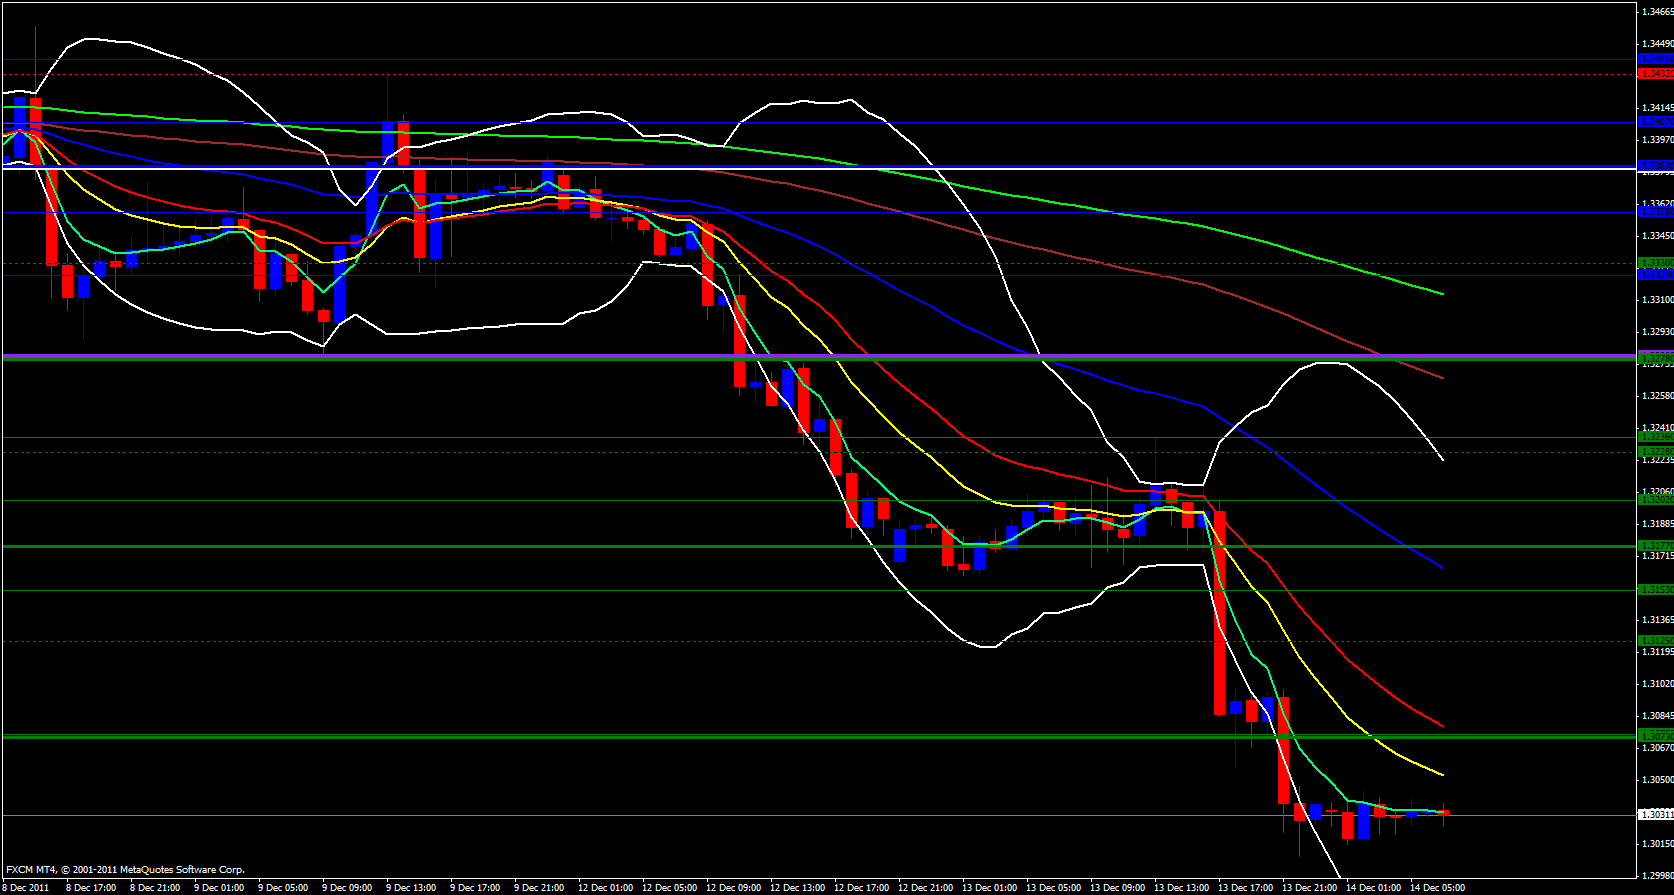
On the hourly time frame price is ranging tightly and centered on the 5 ema I think just waiting for the other ema's to catch up with price just to push it down further. A touch of the 13 or 21 ema's could push price down significantly further down.
Finally, as I mentioned already the price action on the 15 minute time frame is caught within a tight Bollinger band squeeze waiting for release in either direction. Price is still below the 55 ema's on all time frames which means this pair still has further down yet to go.


