By: Doug Rosen
The GBP/USD had an interesting day yesterday strange enough. Considering Christmas and the fact that yesterday was a Bank Holiday I really didn't expect too much movement for this pair yesterday as there was very little moment amongst several other pairs and any movement was purely incidental, the GBP/USD still managed to move 62 pips and the GBP/CHF moved 67 pips.

This pair on the weekly timeframe has already made its way back up to the weekly 5 ema and beyond. It appears to be heading up to the 13 ema which is overlapped with resistance at 1.5770 which is just under the 21 ema. There are also some other elements in that area which tell me that most likely price will fall at that level such as the upper trend line of a triangle price trap and visual resistance I already mentioned.

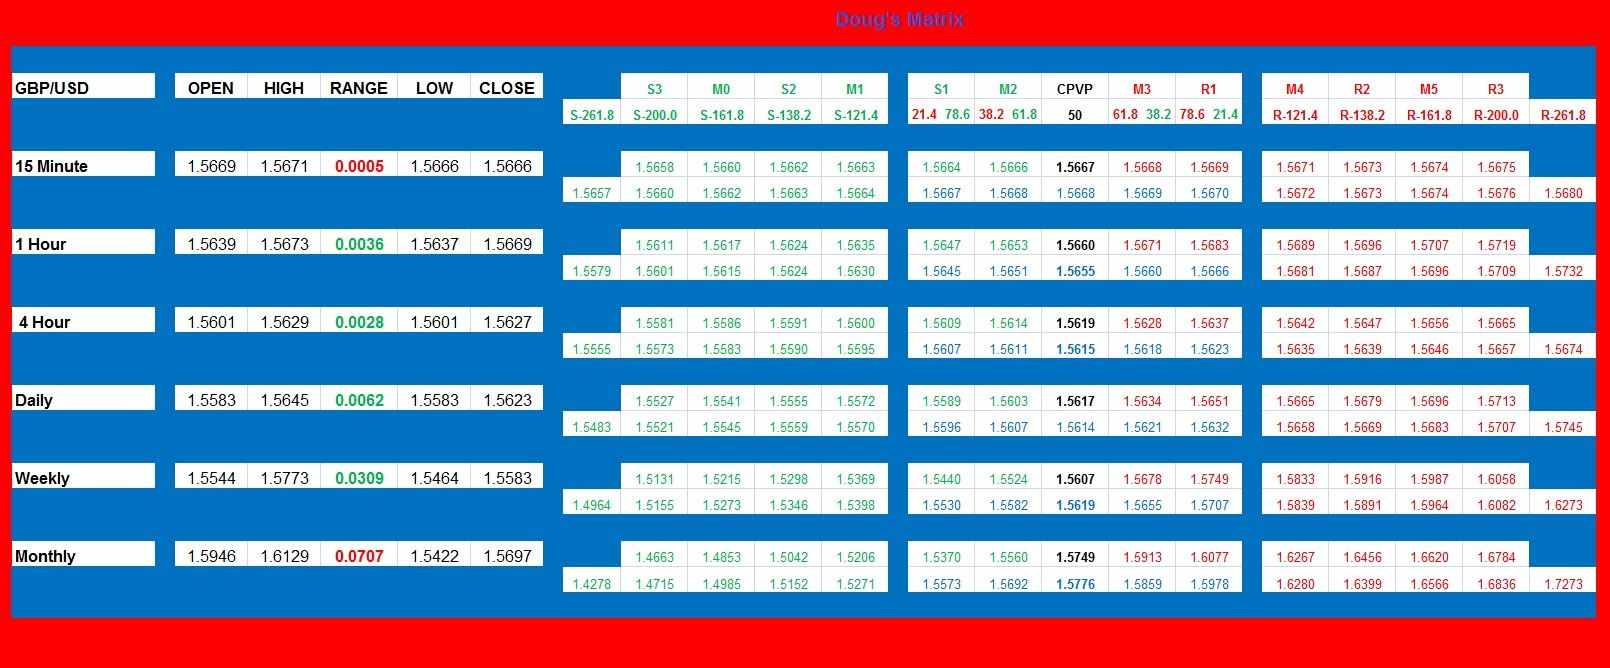
Moving on to the 4 hour timeframe price is just now touching the 233 ema so there will be some resistance at this level, however, I forgot to mention that today will be a Bank Holiday for the GBP/USD so there may not be much follow through before NY Session begins but I still have to observe a 4 hour 233 ema. Most likely price will fib at this level, then head up to 1.5750 - 1.5776 where it will top out and start heading back down. I would like to point out that 1.5749 is the weekly R1 and that is a level I would feel very comfortable entering a short at.

On the hourly timeframe the upper Bollinger band is wide open and pointing up so at the moment it is on to to the upside until we hit the resistance we need to send price back down and cop our short. If and when price breaks above the 1.5678 level which happens to be the weekly M3 then pulls back and makes a retest, I would look to enter longs to 1.5749 but don't get married to that long because you will need to look for shorts around 1.5749 and please bear in mind that when we reach 1.5745 price will officially be at its max since that is the 261.8 fib extension of yesterday's range.


