By: Doug Rosen
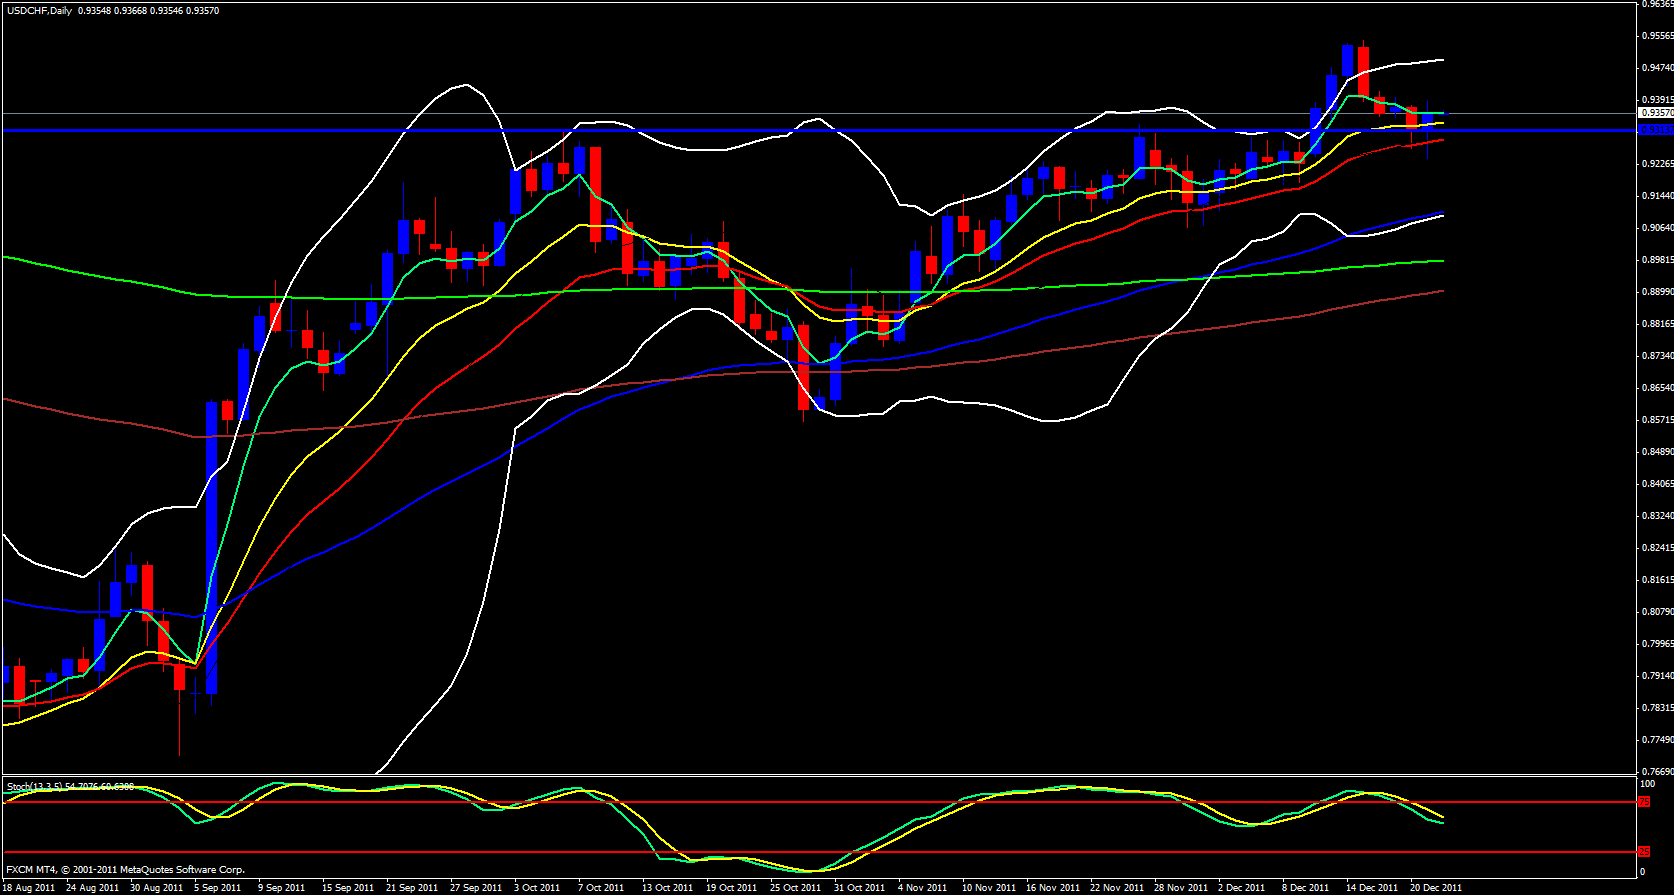
Yesterday the Swissy had a very volatile day. 150 pip range to be exact. Interesting when you think about it since last week's range was like 323 pips. On the daily time frame price came down and pierced the 21 ema and bounced high. Price is now above the support area once again and today's new daily candle starts out above the 13 ema and seems to be heading up.
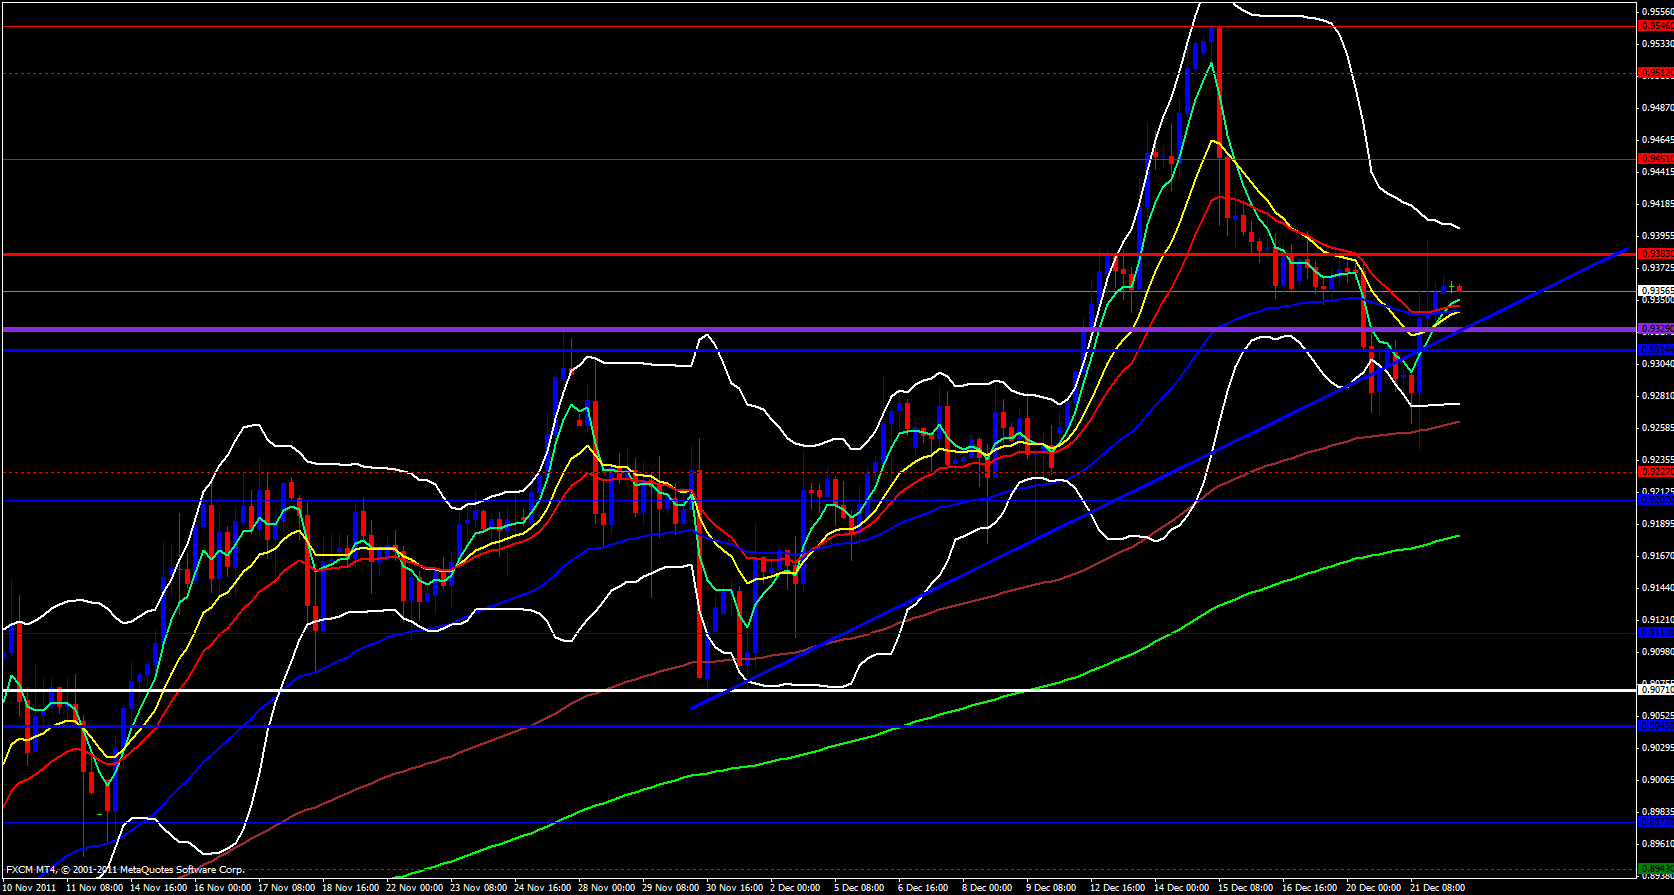
On the 4 hour time frame yesterday price fell way below my trend line, touched the 144 ema and bounced big time and now it is back above the trend line once again and above the ema's. Price still has to deal with the weekly central pivot at .9375 then monthly R1 at .9383 and just a few pips above that is yesterday's high at .9392
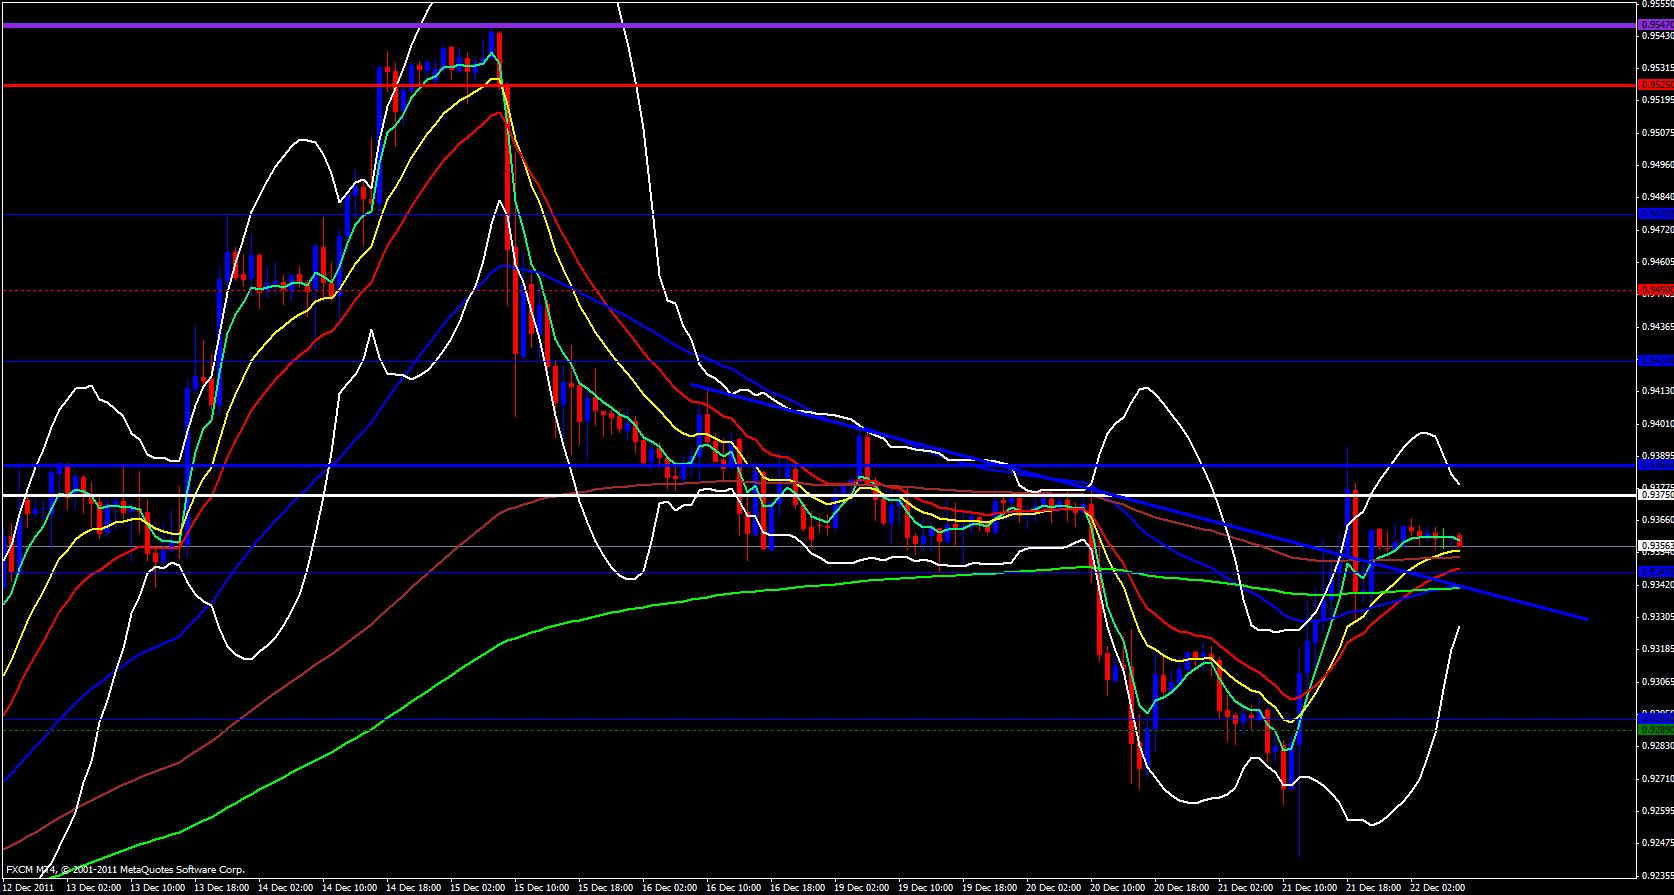
On the hourly time frame price is not looking so bullish since the upper Bollinger band is pointing down and the ema's are getting close to each other.
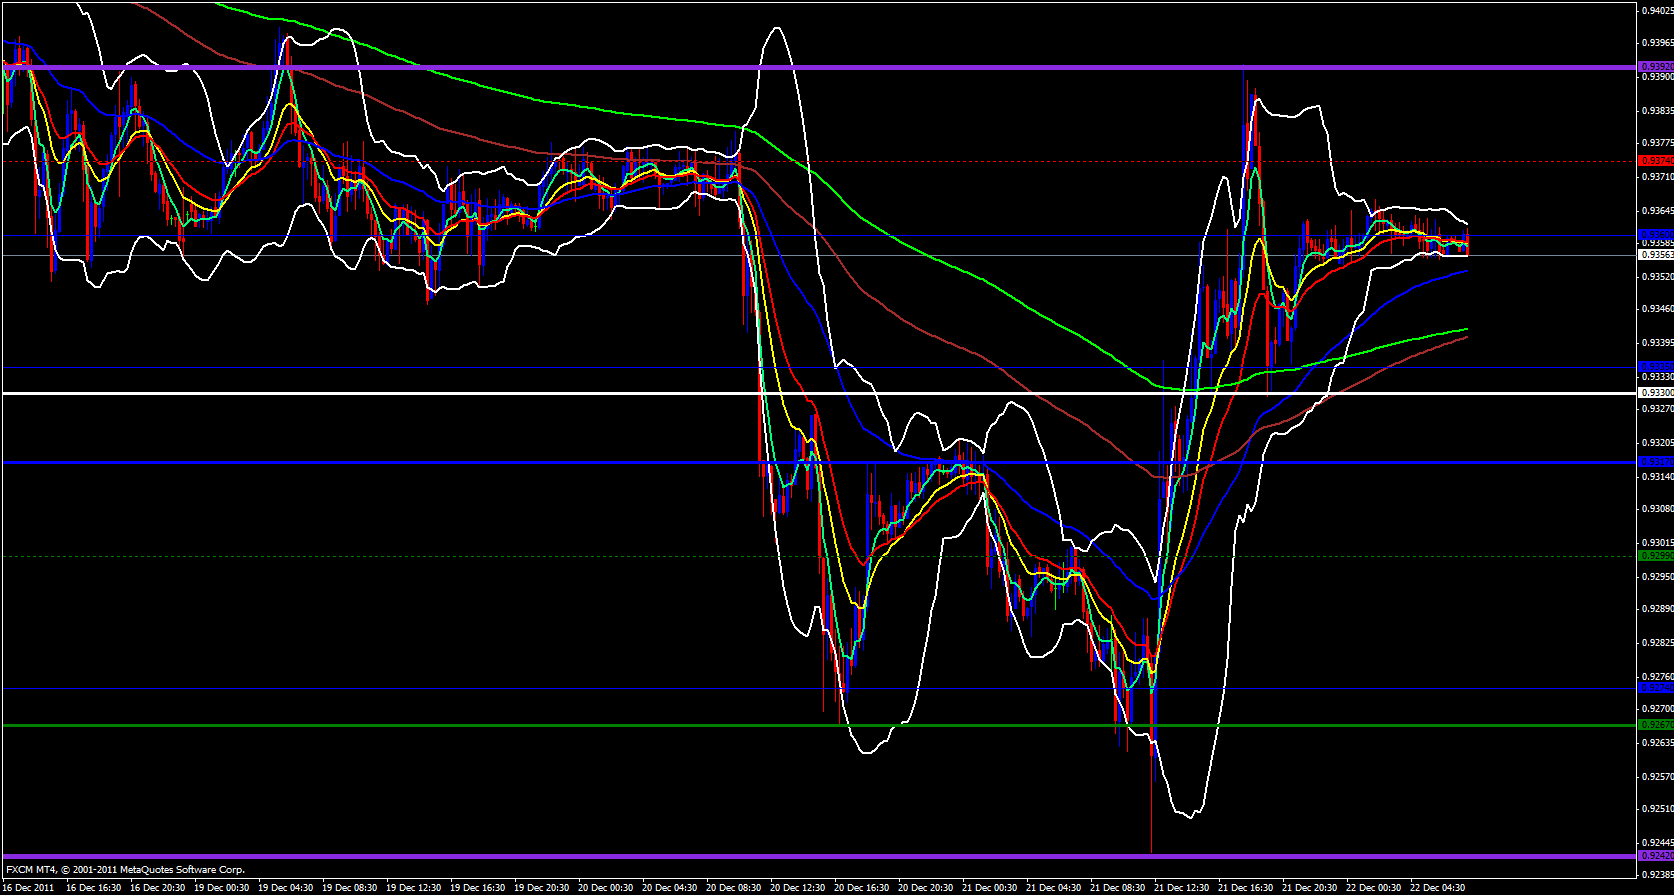
On the 15 minute time frame price is heading down a bit and approaching the 55 ema which I anticipate will cause an upward bounce that should send price back up on its way. If price breaks above .9365 I expect to go to .9390 and possible as high as .9450 then there may be struggle and if it falls below .9350 will go to .9335 then there will be some fight and if it breaks below that level should go to .9280
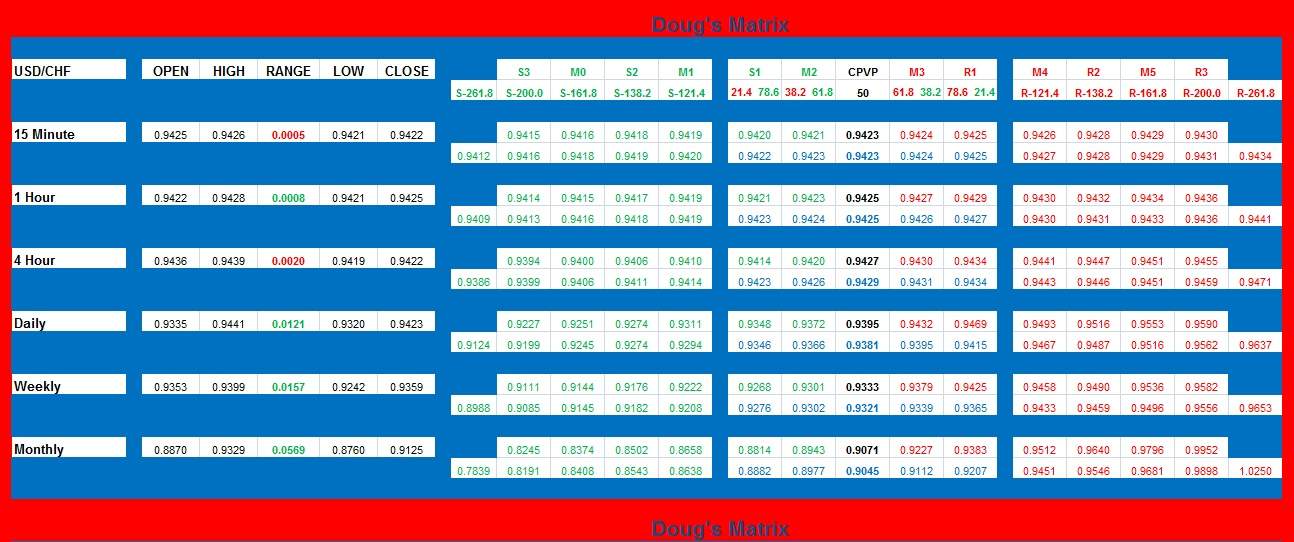
Included in my analysis from now on is my custom made Support and Resistance Matrix of my own personal design. It is complex but will provide you with all the possible support and resistance areas to watch out for. This is strictly a mathematical based system that calculates Pivot Points and Fibs over multiple time frames.

