Start Trading Now Get Started
Table of Contents
Affiliate Disclosure
Affiliate Disclosure DailyForex.com adheres to strict guidelines to preserve editorial integrity to help you make decisions with confidence. Some of the reviews and content we feature on this site are supported by affiliate partnerships from which this website may receive money. This may impact how, where and which companies / services we review and write about. Our team of experts work to continually re-evaluate the reviews and information we provide on all the top Forex / CFD brokerages featured here. Our research focuses heavily on the broker’s custody of client deposits and the breadth of its client offering. Safety is evaluated by quality and length of the broker's track record, plus the scope of regulatory standing. Major factors in determining the quality of a broker’s offer include the cost of trading, the range of instruments available to trade, and general ease of use regarding execution and market information.

AUD/USD Signal-January 3, 2012

By Fadi Steitie

Fadi Steitie is an entrepreneur, investor and professional Forex trader who shares Forex signals with DailyForex.com based on his keen understanding of the market. His favorite pair is EUR/ USD because almost 40% of traders trade this pair and it does match most of his pattern recognition strategies. He is an expert in Elliot Wave principles as well as Ichimoku Kinko Hyu which he is currently researching. So far he has not seen many English translated books about this method of technical analysis, however he is continuing to read about it and believe this method has as much to give to traders like the Elliot Waves method does. Fadi is looking for the magic behind this principle even though many do not research this trading system.

By: Fadi Steitie

Currency: AUD/USD
Trend Expected Direction: Down
Strategy: Ichimoku Kinko Hyo
Description: With a break in support level on 9 Nov with a pull back ended on 7 Dec and another pull just occurring now and might end up tomorrow. The shape that is forming is ascending triangle with a triple tops A, C, E and double bottoms B, D. After the trend hits C, it will do another two small zigzags before it goes into a falling breakout. I do see a good opportunity to short the curency at this high level just below the red shaded resistance line with only half lots and to wait until trend breaks triangle probably end of this week and to add another half lots. The complete trade might take two to three weeks to fall down to 0.9750 area target zone. I will send a detailed follow ups on this trade using Elliott Waves counting and Fib levels.
Action: Short half lots now and another half once trend breaks support line.
Target Area: Open
Stop Loss: 1.0400

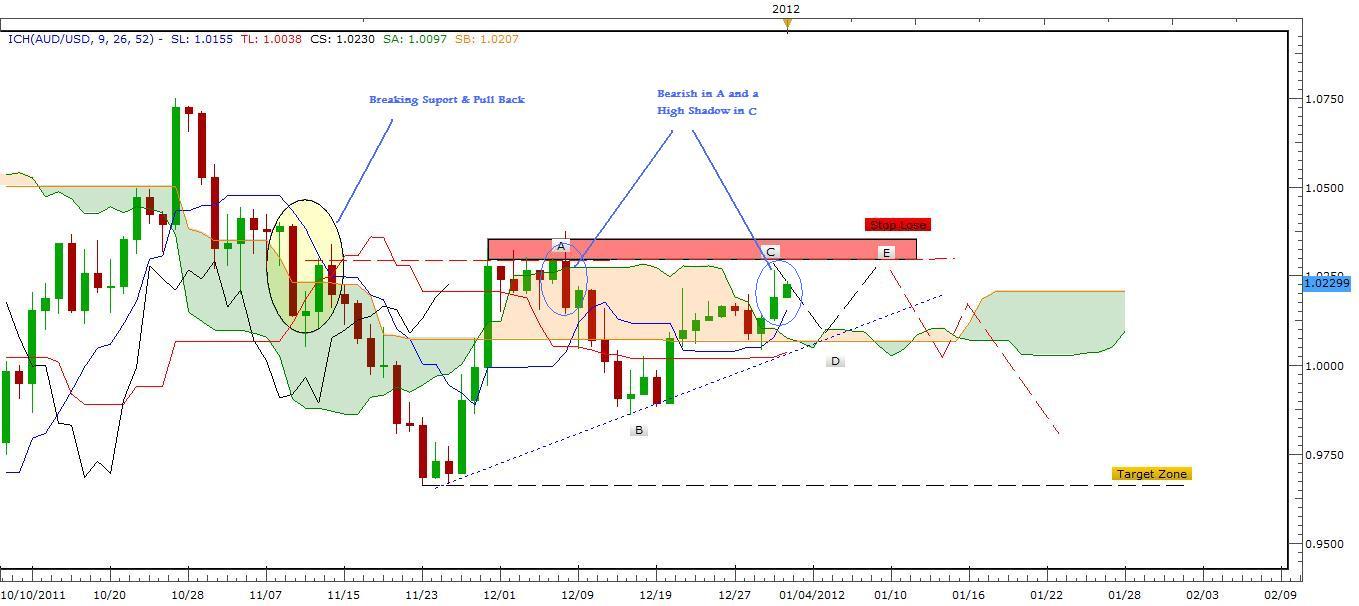
AUD/USD Signal 1/3/12

Fadi Steitie

Fadi Steitie is an entrepreneur, investor and professional Forex trader who shares Forex signals with DailyForex.com based on his keen understanding of the market. His favorite pair is EUR/ USD because almost 40% of traders trade this pair and it does match most of his pattern recognition strategies. He is an expert in Elliot Wave principles as well as Ichimoku Kinko Hyu which he is currently researching. So far he has not seen many English translated books about this method of technical analysis, however he is continuing to read about it and believe this method has as much to give to traders like the Elliot Waves method does. Fadi is looking for the magic behind this principle even though many do not research this trading system.

Most Visited Forex Broker Reviews