This pair makes an interesting study for August. It is very highly positively correlated with gold, but it tends to move more smoothly than gold and with less scope for manipulation, so can be a good alternative to trade for those interested in being exposed to gold.
Starting with seasonality, August usually sees a fall in AUD/USD, although that is traditionally after a rise over the previous weeks and that is certainly not the case this year.
AUD/USD was in a very strong down trend which began in April, but it has been showing signs recently of bottoming out and perhaps even beginning a reversal. Gold in USD terms has exhibited very similar behaviour. Both have reached lows during the last few weeks not seen for almost 3 years.
One of the beauties of trading is that you make money less by being right than by being really right and sitting tight. With patience and discipline, you can make small bets early, when it looks like the payoff will be huge if you are right, and even if you are wrong a lot of the time it is still a very profitable approach.
August looks likely to give us this kind of long-shot as a long trade on AUD/USD.
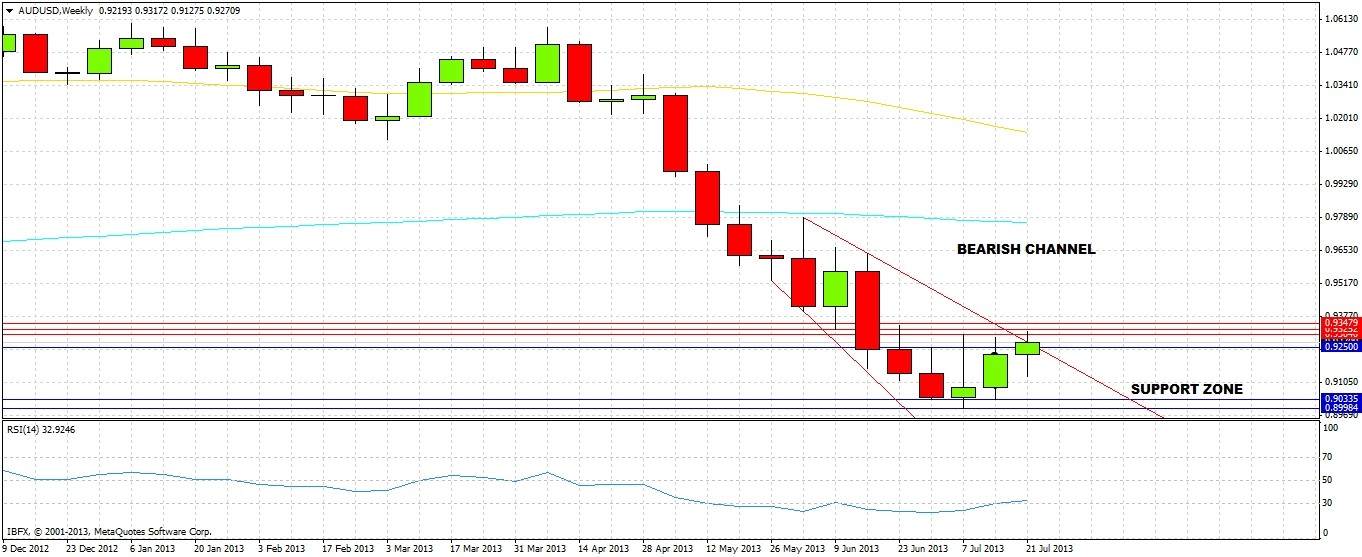
Let's look at the weekly chart to see how things stand:
 In my analysis last week of AUD/USD on Wednesday 17th July, I declined to make concrete predictions due to the uncertain technical behaviour of this pair. I did mention a weak possibility that we were likely to see 0.9304 before 0.8997, and that did in fact happen.
Let's take a look at what has happened over the past week:
The last three weeks have closed up. What is most interesting about this formation is that it has a rounded bottom, suggesting distribution. Its shape is indicative of a reversal, although in a downwards trend as strong as this, it would be wise not to expect a very sudden reversal.
The week before last was an inside bar, which was broken to the upside last week. We see also that the price is right on the upper trend line of a bearish channel established in recent weeks. The RSI is just breaking above 30, which can be a bullish sign. However the price is facing three levels of strong resistance overhead at 0.93, 0.9325, and 0.9350.
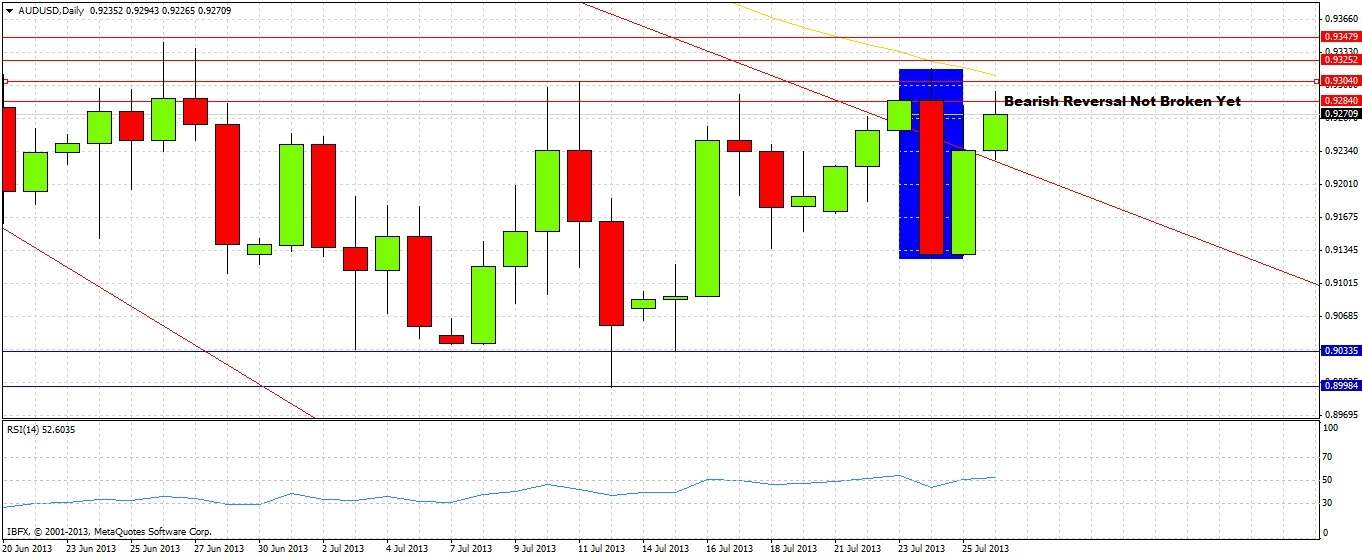
Let's turn to the daily chart for a closer look:

On the daily chart we can see that although last week closed above the upper trend line, it is not yet a true breakout as the bearish daily reversal from last Wednesday has not yet been broken to the upside. There is a zone of strong resistance overhead stretching from 0.9285 to 0.9350. Apart from this bar, the daily action has been meandering and inconsequential, suggesting aimlessness. The RSI(14) indicator shows we are close to a decisive breakthrough of the key 50 level. The strength with which the price snapped back from the low of the bearish reversal is indicative of suppressed bullishness.
It is likely that if we get a day (or even better, a week) closing above 0.9350, there will be growing belief that the time is ripe for a significant bullish pull-back that might even signal the reversal of the downwards trend. It is very hard to say how far such an upwards move would go – but we did recently see a three year low, so it might be a long way.
I think we will see a break of 0.9350 during August. Traders looking for high reward to risk ratio trades would do well to either play conservatively and wait for such a breakout before entering long and being patient, possibly with a wide stop. Alternatively, a more risky but possibly more rewarding approach would be available if, before breaking 0.9350, the price were to pull back closer to 0.90, allowing an aggressive long entry with a stop at about 0.89.
Even if 0.9350 is not broken, I doubt that August will see a break of 0.8995 to the down side.
