
My last analysis of AUD/USD on 4th July last week ended with a recommendation to look for a short during the rest of the week:
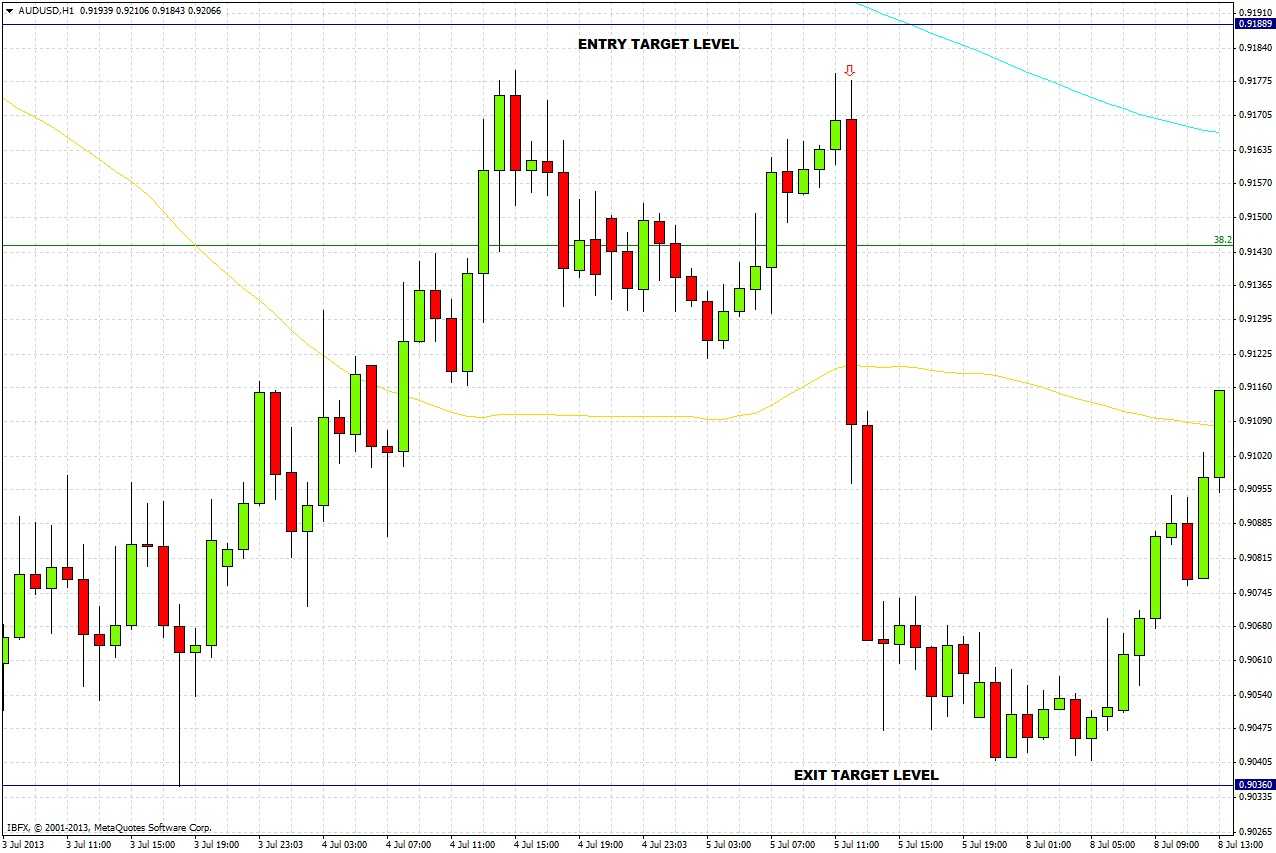
“A good entry point from now until the close of tomorrow's London session would be at a reversal from a retrace to yesterday's high of 0.9189. An initial target is yesterday's low of 0.9036...”
The hourly chart below shows that the price came to within a few pips of 0.9189 before falling to just a few pips short of 0.9036. The best entry would have been just as the USD-positive non-farm payroll number was announced on Friday afternoon.
Last week we saw the monthly chart was suggesting a move down to 0.8914. This is still true, but dropping down to lower time frames shows a suggestion of a different story.
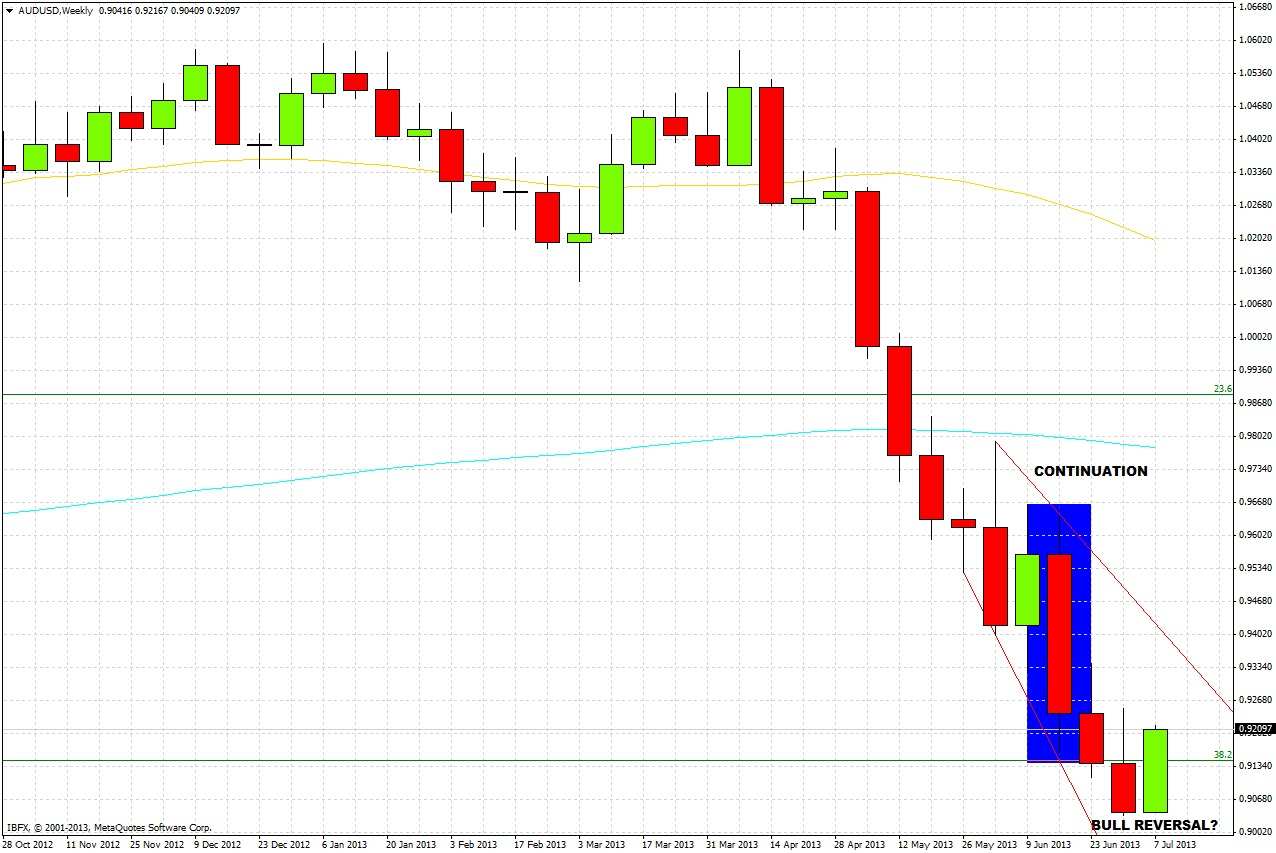
The weekly chart shows that this week is currently tracing out a bullish reversal candle. Last week's low of 0.9036 has held. The price is now above last week's close of 0.9042, and if it holds to close above that level this Friday, this week will be a bullish reversal.
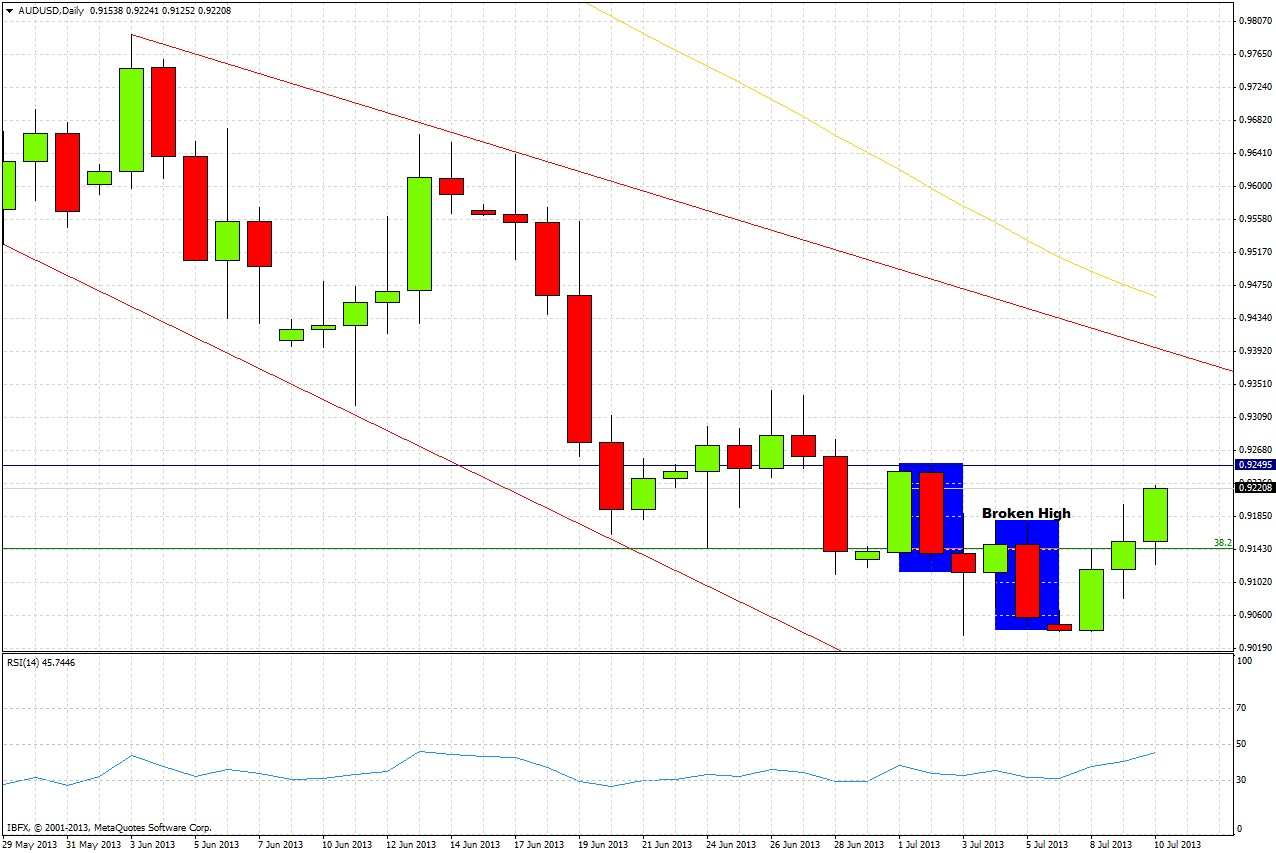
The daily chart confirms this more bullish picture. The most recent bearish continuation bar of 5th July had its high broken this morning, invalidating it. So far each day this week has closed up, and the price is now approaching the high of the bearish continuation bar on 2nd July at 0.9249. The RSI-14 indicator is approaching the crucial level of 50, first breaks of this level on a daily close can be significant.
I had expected that we would hit a more key level of support before this down trend could reverse, so I am doubting we have already seen the bottom of this current move. However there are undeniably bullish signs showing there may be a profitable long trade ahead.
For the rest of this week, if the price continues up to around 0.9250 and shows signs of reversing there, this could be a great entry level for a short trade. However if the price breaks upwards through this level decisively, we should see it continue to at least 0.9340-50. As this pair is close to a three-year low, it would make sense to try to hold onto at least a small part of any long trades, in case we have in fact seen another long-term low here and the beginning of a 1,000+ pip move upwards.