By: DailyForex.com
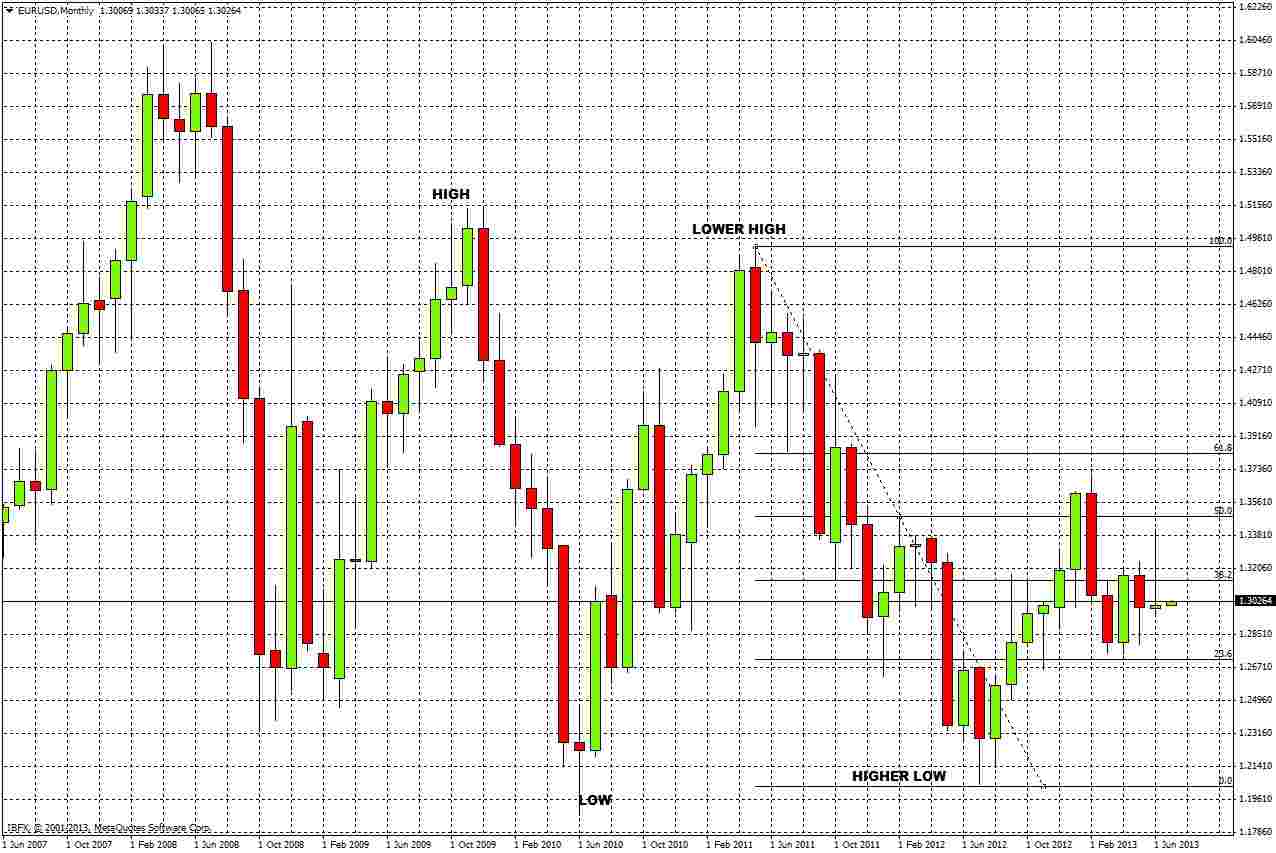
Beginning with the long-term picture from the monthly chart, this pair has been in a downtrend over the past several years, albeit one with plenty of pull-back to the upside. The major low made in July 2012 was higher than the previous low from June 2010, suggesting a long-term consolidation between about 1.50 and 1.20.
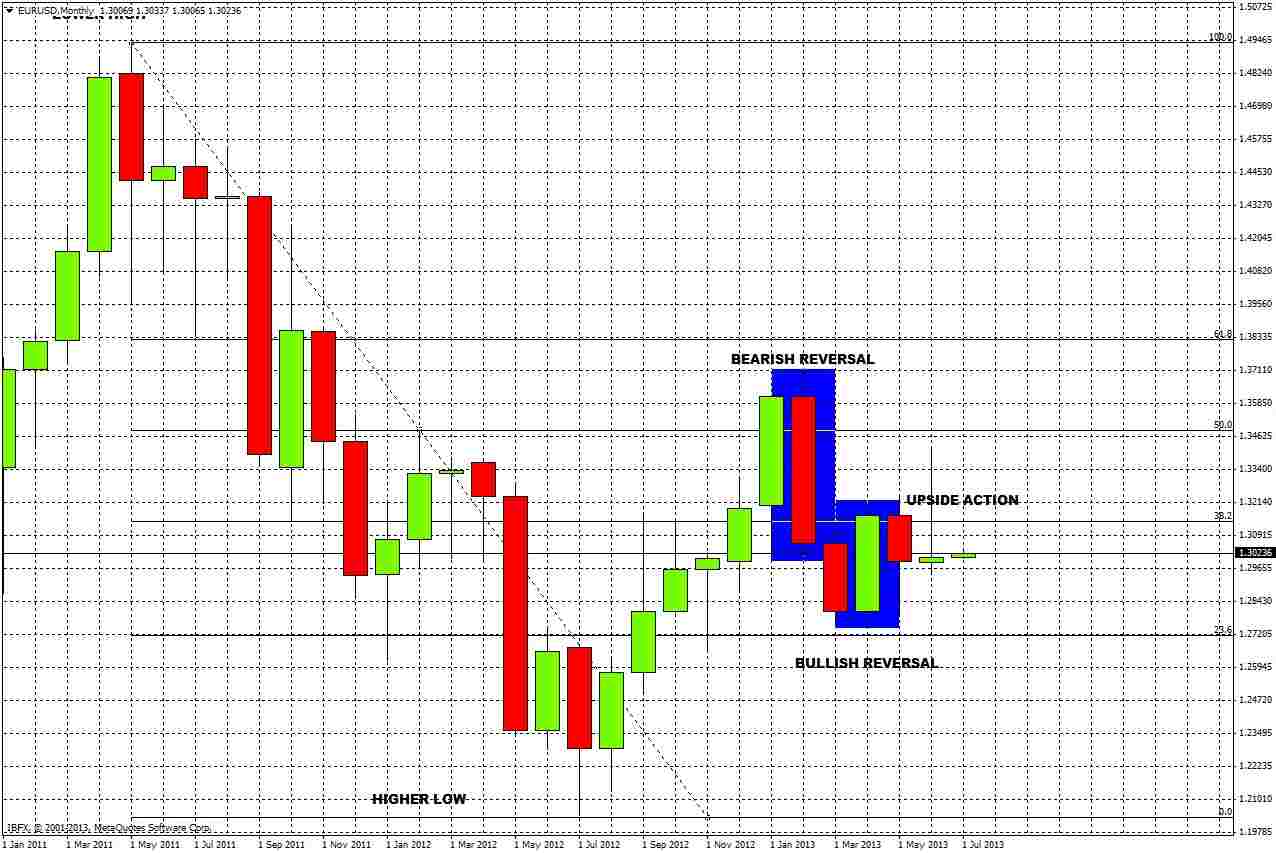
The tendency to consolidate is reinforced by recent action: the bearish monthly reversal last February at the 50% fibonacci retracement of the 2011-2012 downwards move was itself reversed by a bullish monthly reversal in April.
However there are three factors that indicate the next move will be bullish:
1. The most recent monthly reversal was bullish.
2. The low of that monthly reversal at 1.2744 has not yet been broken.
3. The month that has just ended closed above its open, and its action was to the upside of where the price is now.
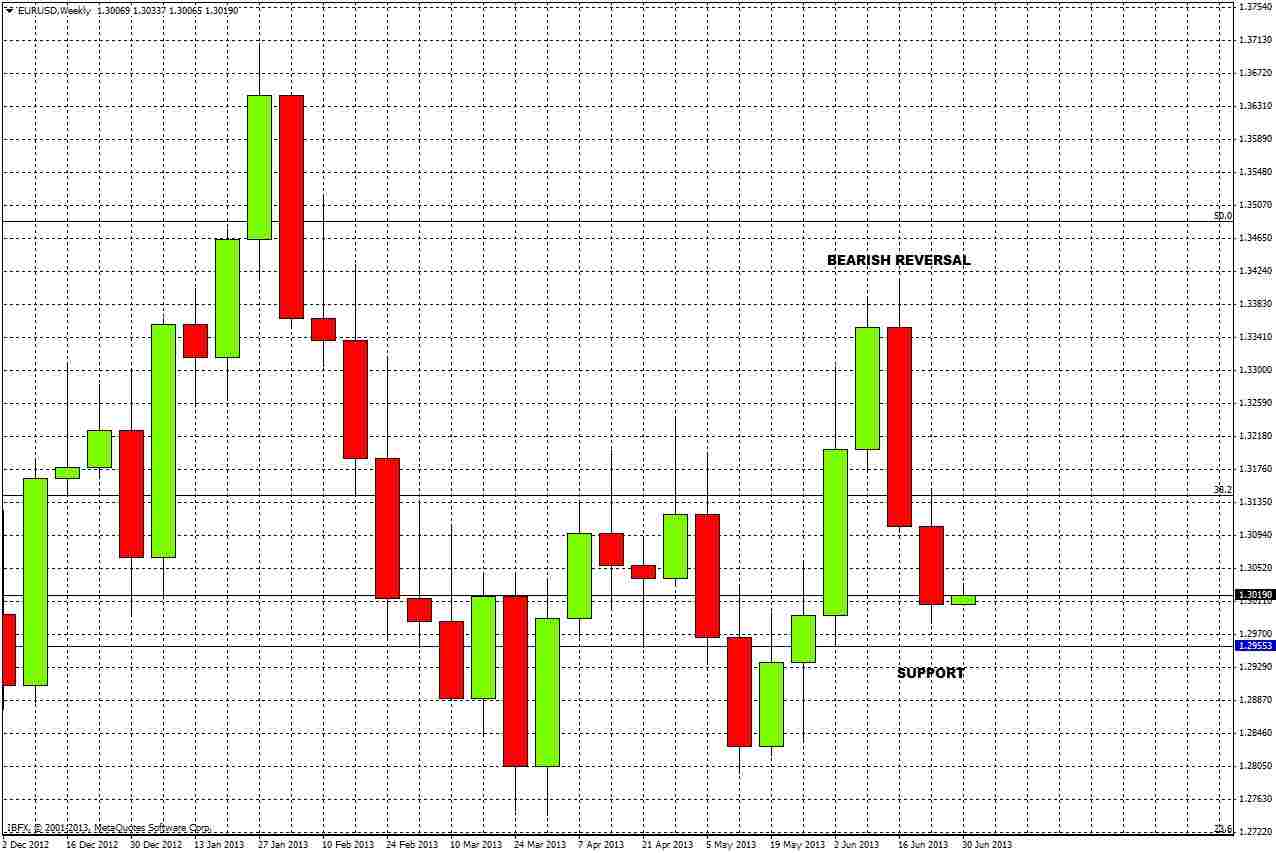
The weekly chart shows a bearish reversal two weeks ago. Last week the price continued down. It may have bottomed already as it hit the weekly open from four bars back. In any case the low of 1.2955 from four weeks ago is likely to hold as support.
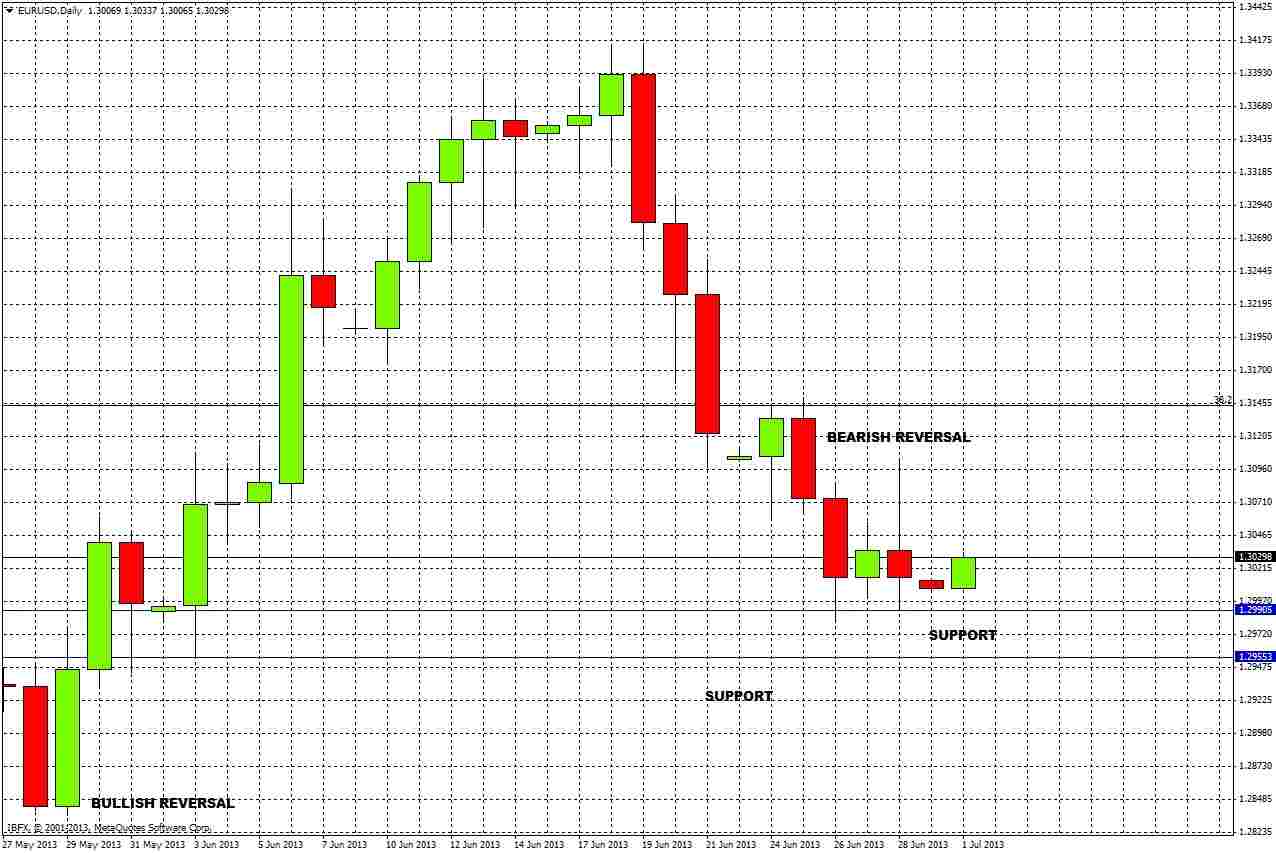
Finally, dropping down to the daily chart, we see that last Friday produced a bearish reversal. This suggests that the price is now likely to move down to Friday's low of 1.2990 before moving up.
Monday often produces cagey price movements which can be frustrating for traders. There may be a good opportunity to go long today or later this week if the price falls down to a level between 1.2990 and 1.2955. The bulk of profit should be taken conservatively as we are unlikely to penetrate last week's high of 1.3150, and approaching this level there is selling pressure. This high also coincides with the 38.2% Fibonacci level of the retracement I mentioned in the monthly analysis.
If the price breaks below 1.2955 it will need some momentum to penetrate the low of the bullish daily reversal of 29th May.


