In my analysis of GBP/USD last Wednesday 17th July, I declined to make any predictions, saying that “this pair looks like a waste of time for directional trading.”
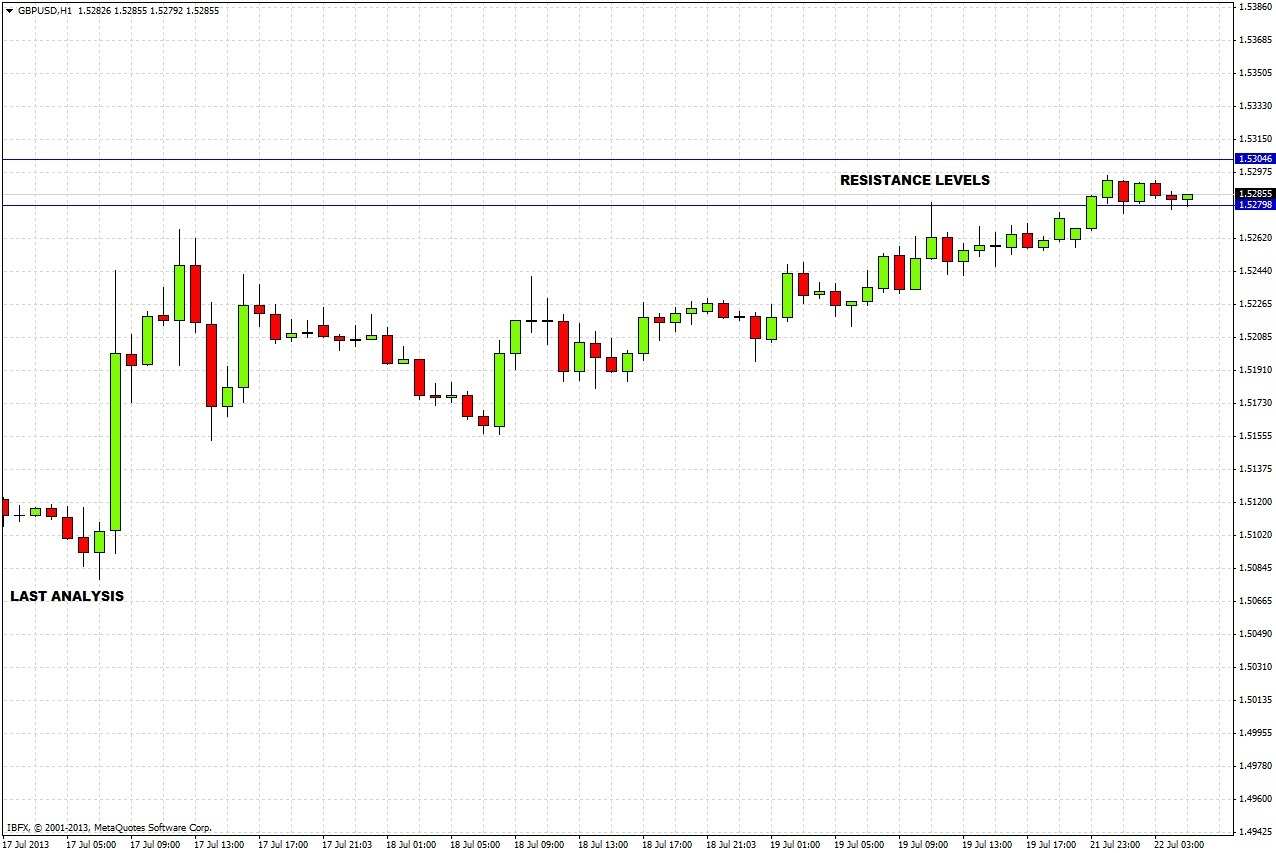
In fact, the UK economic data that was released very shortly after my analysis had a very bullish effect on this pair, which shot up about 140 pips in half an hour or so. By the end of the week the bullish action had comfortably broken through the resistance at 1.5207, closing last week very bullishly just below the resistance at 1.5280:
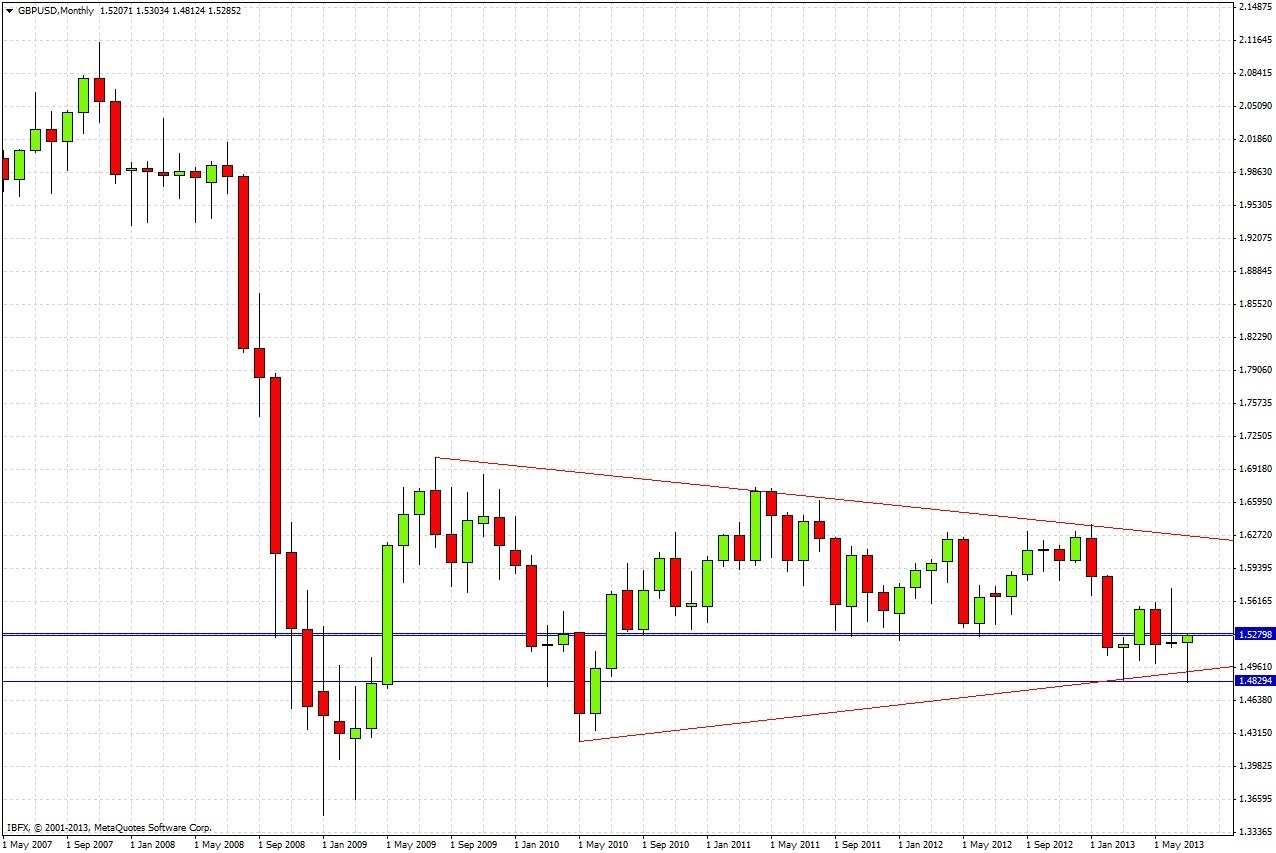
What of the future? The monthly chart looks bullish, forming in this current month a bullish pin bar off the lower trend line of the long-term consolidating triangle:

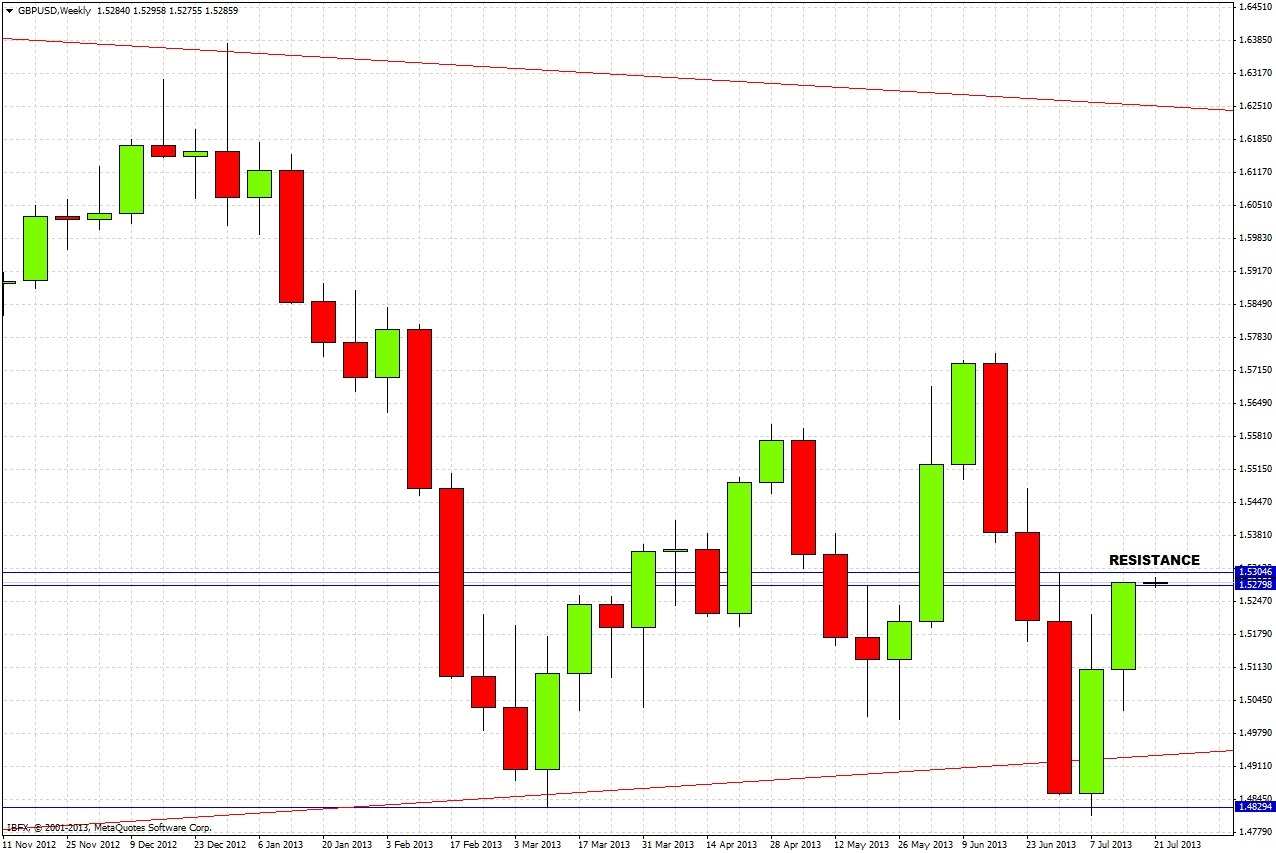
The weekly chart supports this bullish outlook, but we can see this bullish move is not as strong as the bearish move that preceded it. We are close to the resistance level of 1.5303, which is the high from the bearish week that occurred three weeks ago. We are in a resistance zone between 1.5280 and 1.5303:

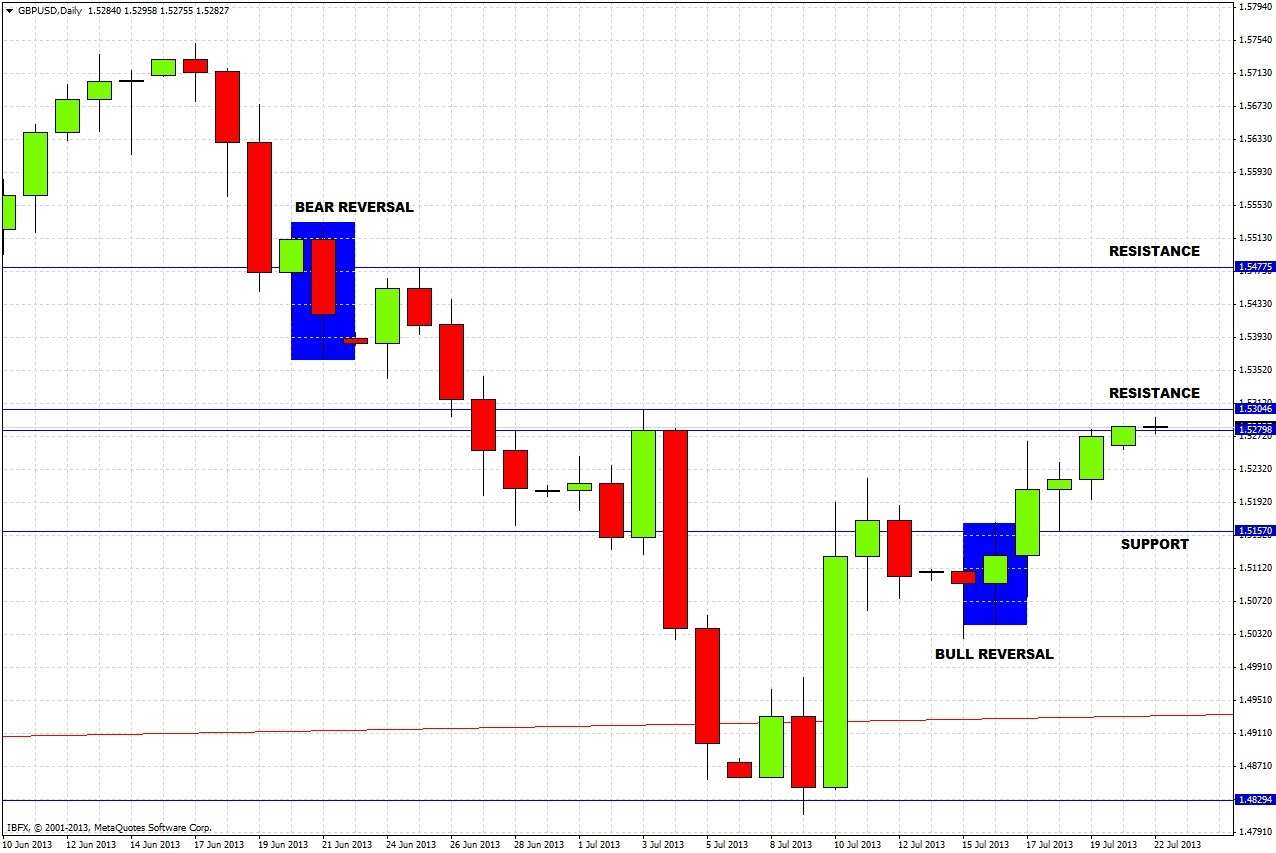
Taking a closer look at the action in the daily chart makes things a little clearer:

The chart shows that we are in a bullish run that began last week, that has run into resistance. There is support below at 1.5157 where there was strong buying previously.
If we break 1.5305 decisively, we are quite likely to continue upwards until we meet the next major resistance level at around 1.5478.
If we are unable to break 1.5305 decisively, and we reverse and fall with momentum below 1.5280, we are likely to reach 1.5200 and possibly 1.5157.
For the time being, the momentum is bullish.
