
USD/JPY has been one of the most stable major pairs in recent years, until it exploded upwards last October, rising for eight consecutive months and eventually reaching close to a five-year high.
Last month however saw a sharp fall and quick rebound, but the monthly close was bearish.
The momentum behind the strong recent rise suggests there is still more upside to come. A closer examination of the monthly chart over the last decade shows that the concept of pivotal points (support turning into resistance and vice versa) yields more detailed clues to future direction.
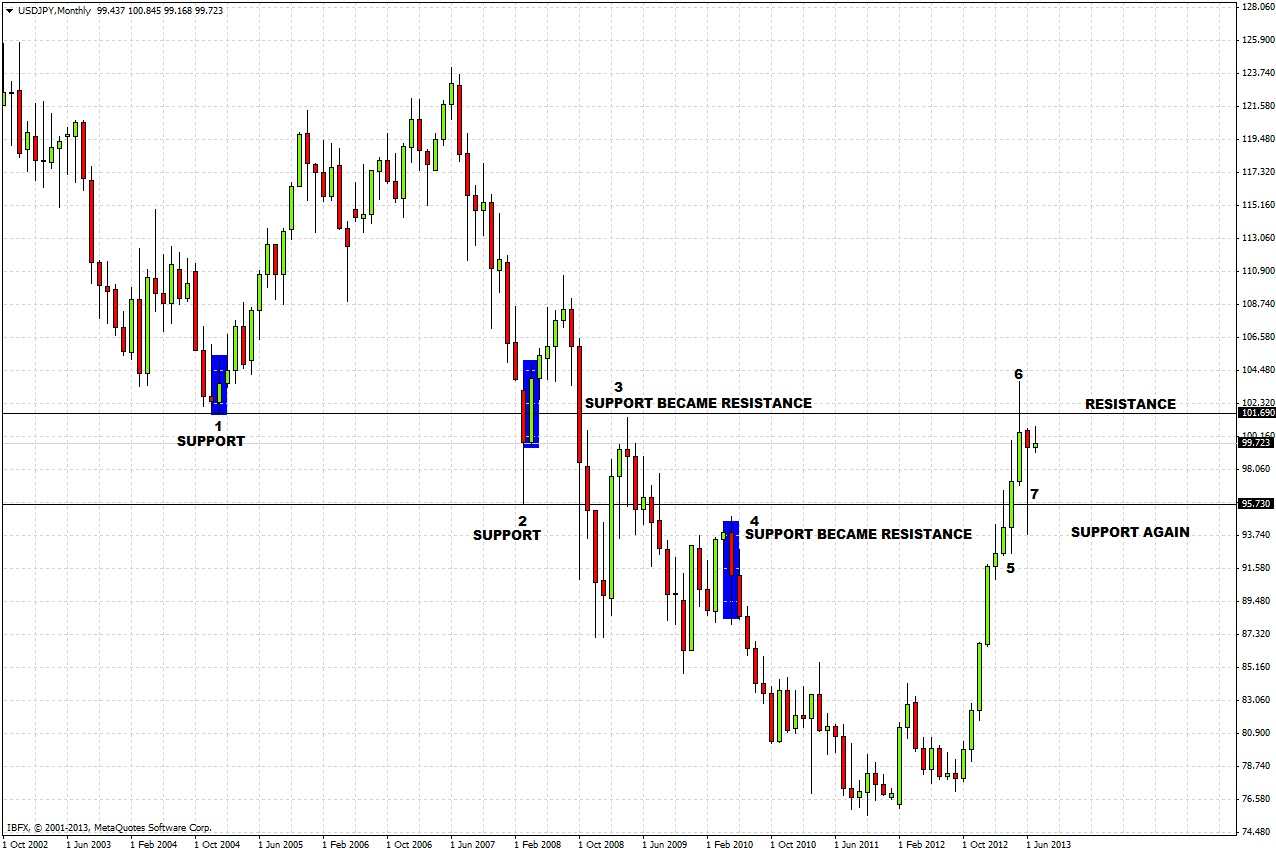
1. A level around 101.69 was established as major support in January 2005 by a bullish reversal bar.
2. In March 2008, the 101.69 support level was broken, and the level of 95.73 established as major support by a rejection and the next bullish reversal bar.
3. A few months later, the support level of 95.73 was broken. The price then came back close to the old support level of 101.69, before falling again. This established the area around 101.69 as a pivotal point, where support became resistance.
4. In May 2010, the price came up close to the old support level of 95.73, before falling again with a bearish reversal bar. This established the area around 95.73 as a pivotal point, where support became resistance.
5. Last April, the price broke through and closed above the resistance around 95.73, invalidating it.
6. Last May, the price broke above but was rejected from and closed below the resistance around 101.69, confirming it.
7. Last month, the price fell down to the old resistance around 95.73, and rejected the level sharply. This indicates that this area has again pivoted to now become support.
This leaves us with two zones bracketing the current price: 101.43 to 101.69 as resistance and 94.97 to 95.73 as support.
The weekly chart is very revealing. Six weeks ago there was a bearish reversal bar at the resistance zone, while more recently there was a bullish reversal bar at the support zone:
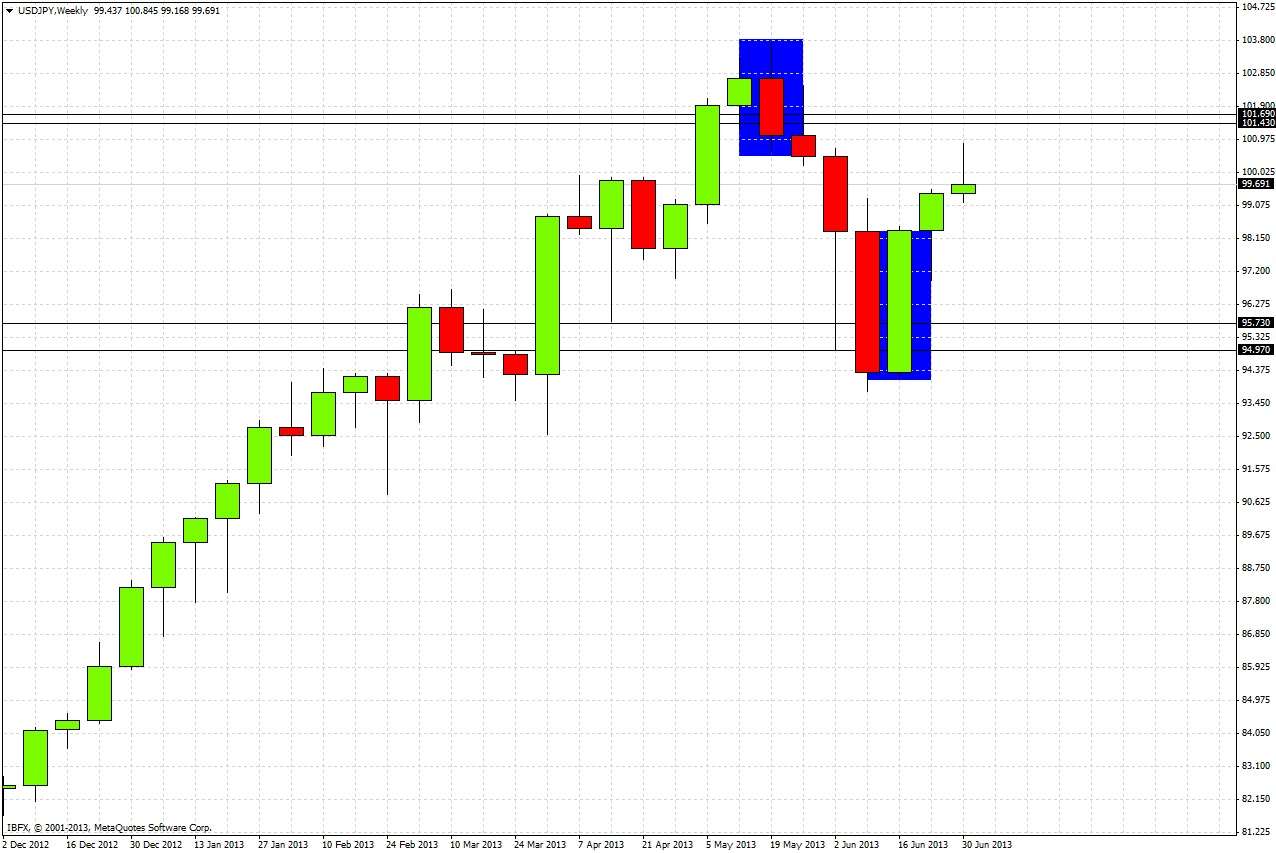
This suggests that:
• The price is trapped between these reversal bars, and will be prone to bounce around between the quite narrow area between 98.50 and 100.65 for a few days.
• The price will need to break one of these reversal bars decisively before traders can be confident of a longer directional move.
• As the most recent reversal bar is bullish, and the monthly trend is very bullish, the break when it comes is more likely to be to the upside.
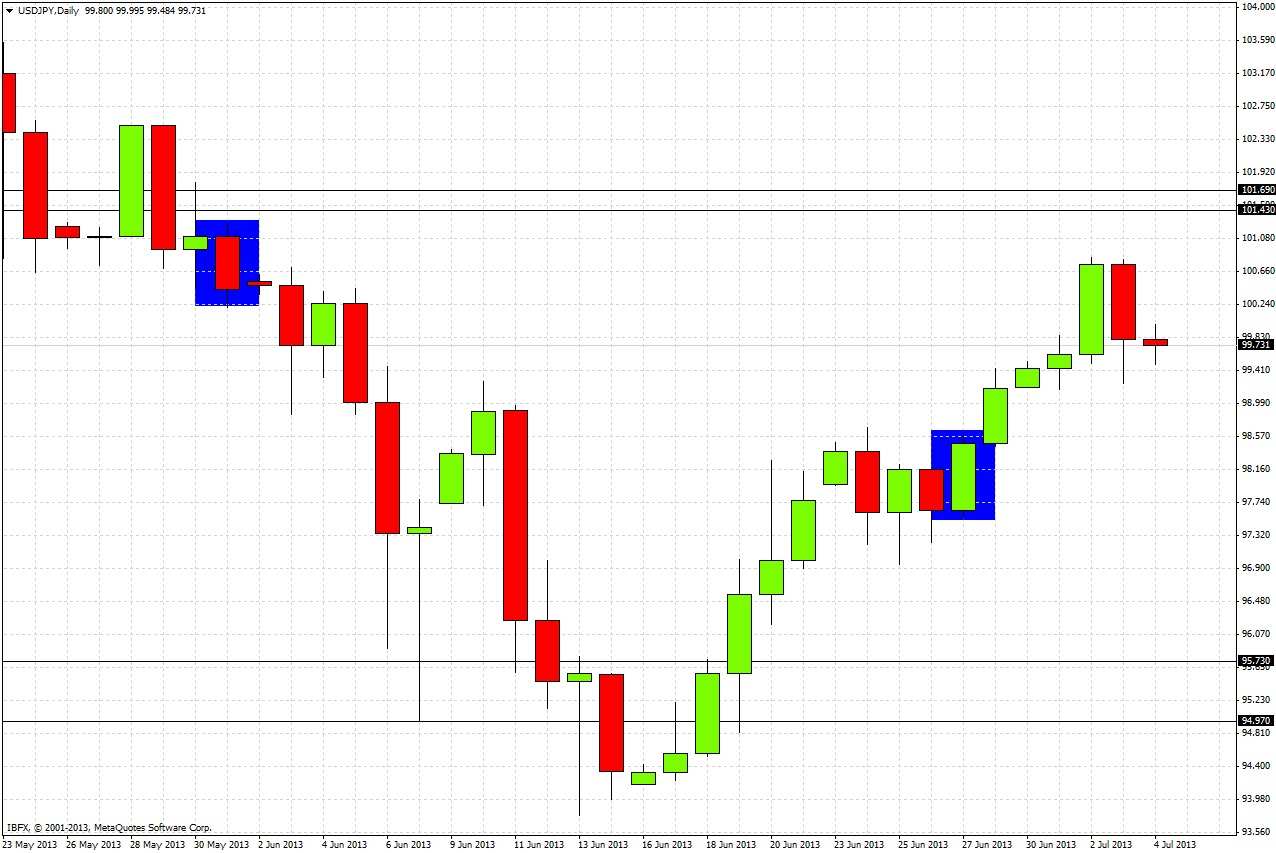
The daily chart seems to confirm the bullish bias, as the most recent reversal bar was bullish. However, yesterday the price fell from a level last seen on 31st May, suggesting a short-term move downwards, perhaps as far as the high of the last bullish reversal bar at 98.60:
We have some useful conclusins to bear in mind in planning trades in USD/JPY:
• The longer-term trend is still bullish as long as the support zone of 95.73 to 94.97 holds.
• Price is currently likely to range between 98.50 and 100.81 in the short term and between 95.73 and 101.43 in the longer term.
• Price is nearer the top of its range, so shorts look more probable than longs in the very short term.
• If the price breaks 103.73 decisively to the upside, the next logical long-term target is 108.44.
• If the price breaks 94.97 decisively to the downside, the next logical long-term target is 90.87. Several areas of support will have to be broken to get there.