The last analysis of this pair one week ago concluded by summarizing the situation like this:
"Apart from the triangle trend lines, a good bullish reversal on the intraday chart at around 97.00 could be a tradable long.
I recommend trading reversals from the triangle trend lines, or any directional breakout confirmed by a daily close beyond either line. Waiting for a retest of the trend line from the other side could work well, as it did after the last triangle breakout. The triangle is going to have to break by the end of August, and will most likely happen before the end of next week."
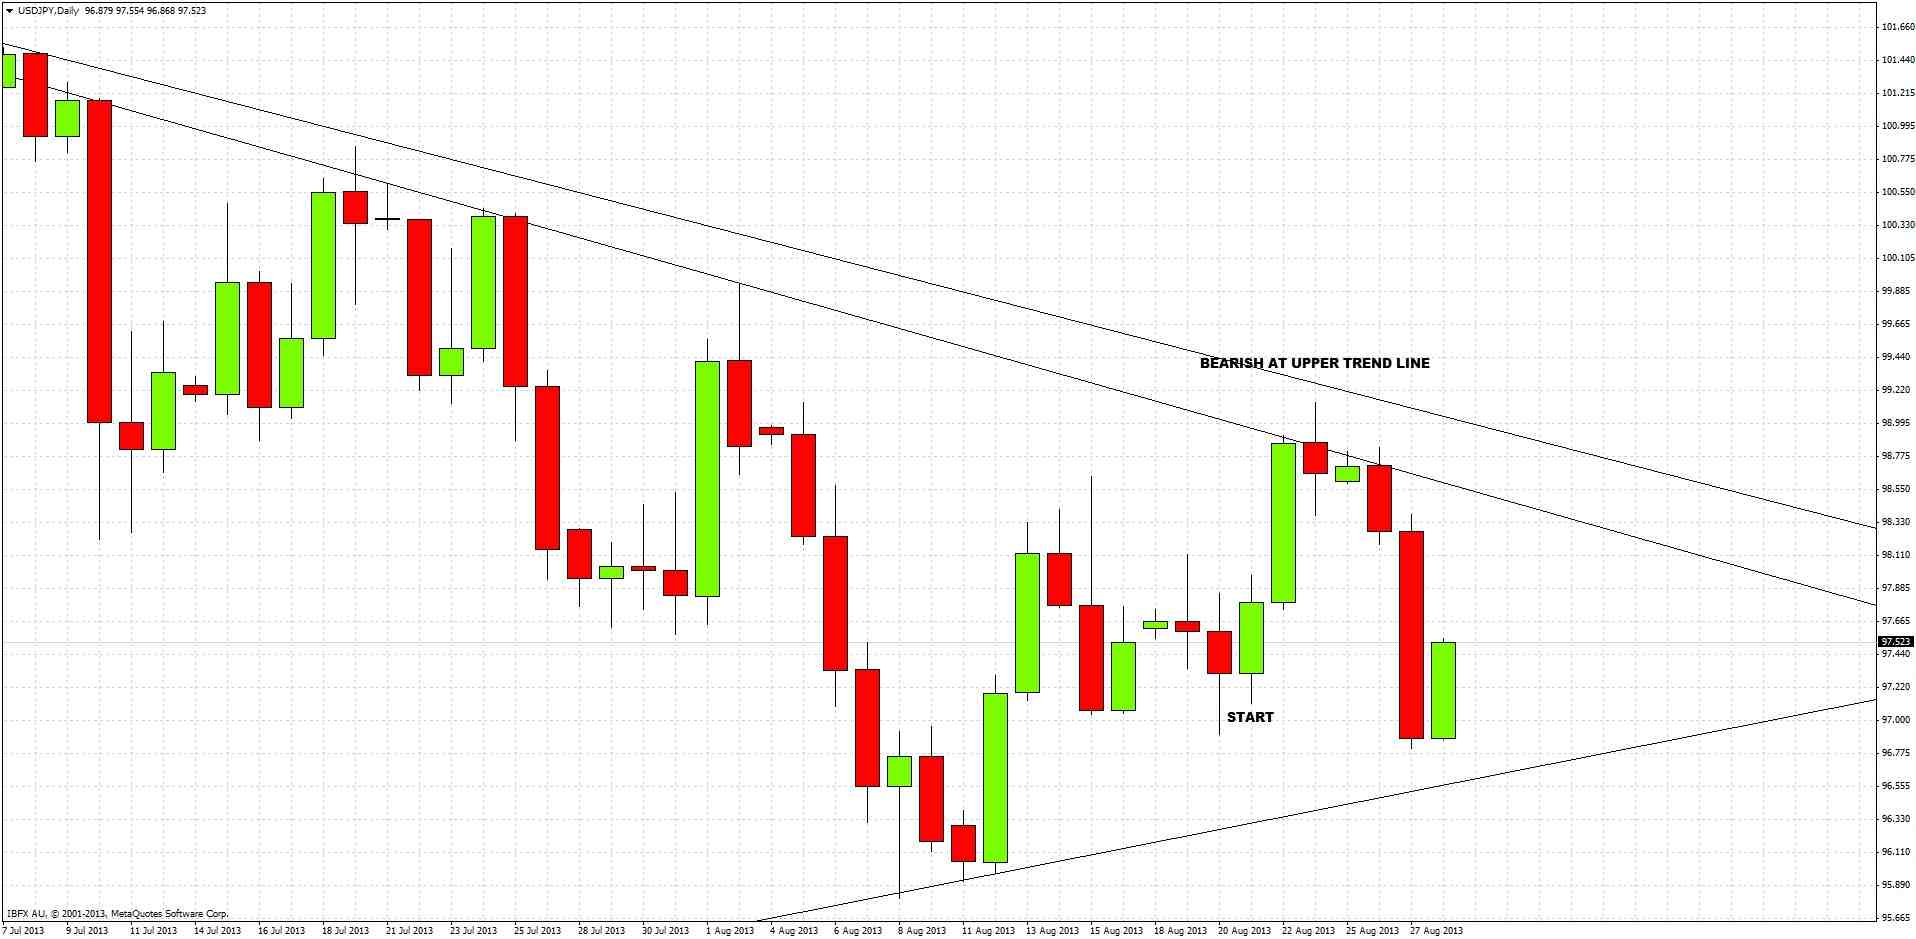
This worked out excellently. The next day closed very bullishly but right on the upper triangle trend line. There was no daily close beyond it, and the price fell pretty sharply after that, in fact it just hit last week’s low. So trading a reversal at the trend line would have been a great short trade:
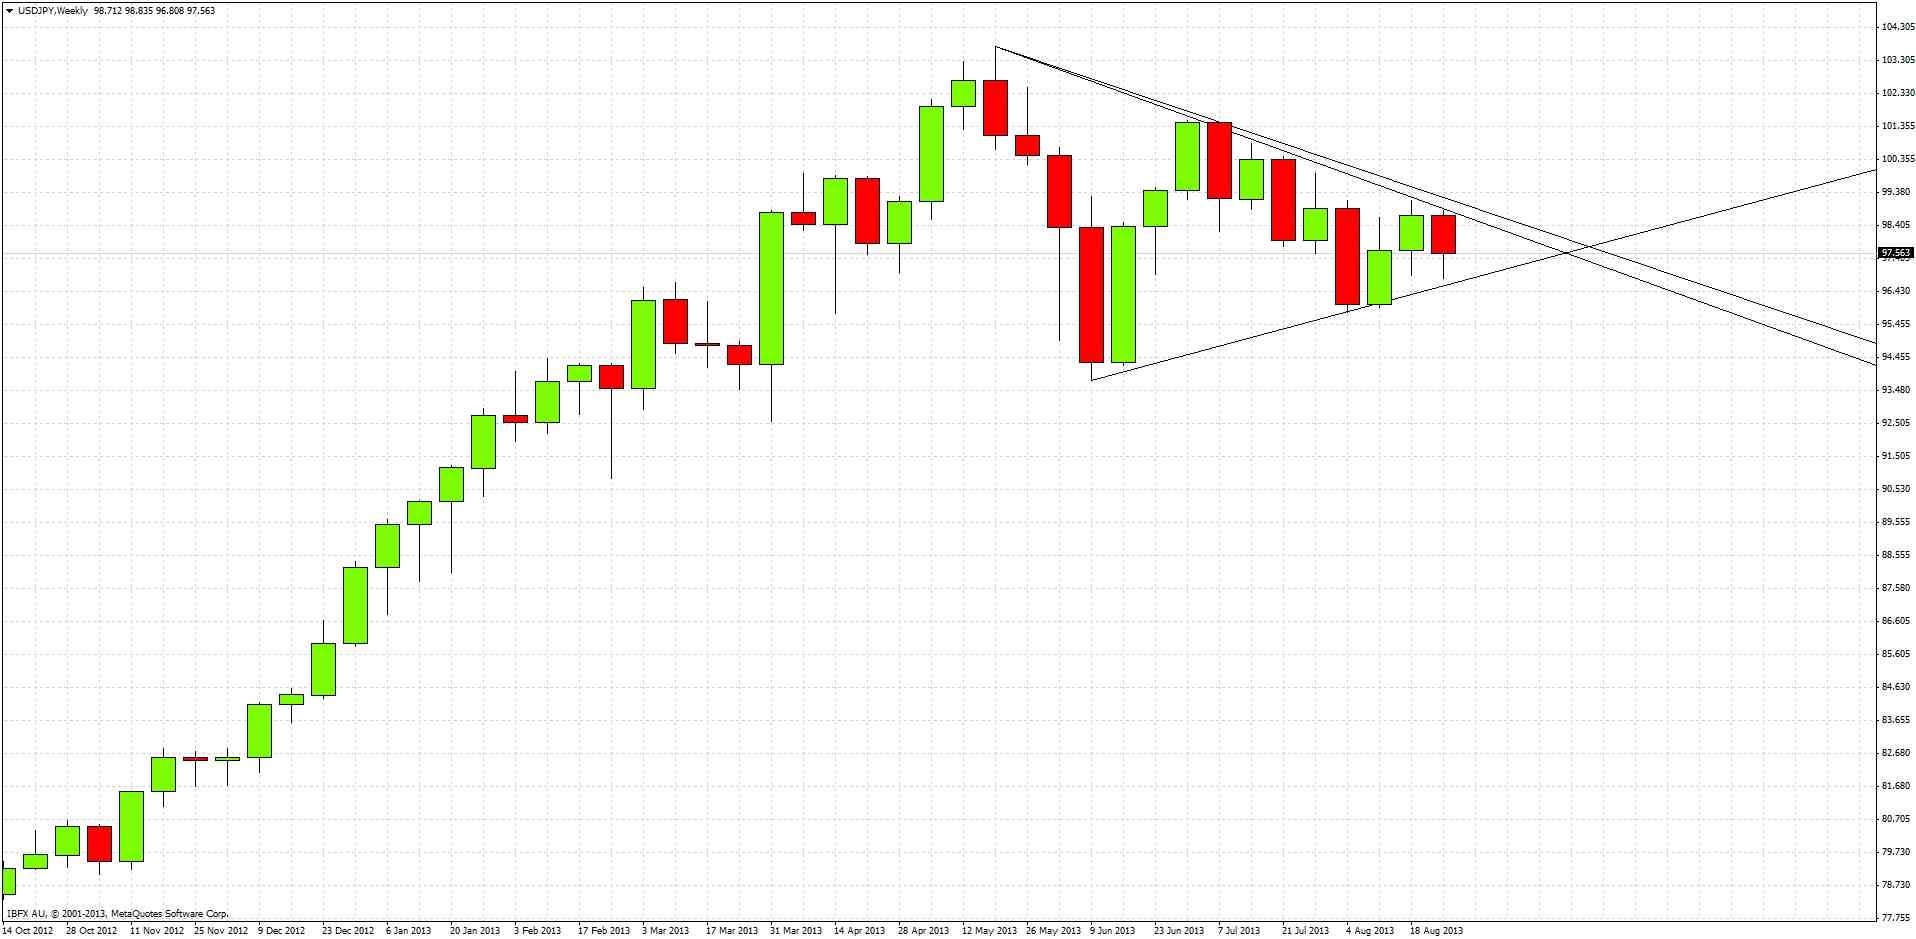
Looking to the future, the picture is still very obvious – this pair is still stuck in a consolidating triangle formation. The weekly chart adds little to this picture except to reinforce it:
This week’s action so far is bearish, but we still have half the week left so it is better not to draw any conclusions yet.
In the short term, there may be scope for some conservative long trades as we had a bullish bounce off last week’s low of 96.90 this morning. The level was only broken by about 10 pips, and has risen to 97.50 at the time of writing. Day traders could look for longs after an appropriate pull-back, targeting 98.00.
In the longer term, a crucial point is approaching: the triangle is running out! The price has to break out somewhere over the next couple of weeks. The weekly chart above shows that this triangle has been forming all summer. Breakouts of summer triangles can be really powerful, as we saw with EURUSD at the end of the summer of 2011.
We can conclude with the same recommendation as last week: trade reversals off the triangle trend lines, or a daily close breakout beyond the trend lines in either direction. Aggressive traders can enter immediately, more conservative traders could wait for a pull-back and retest of the broken trend line.
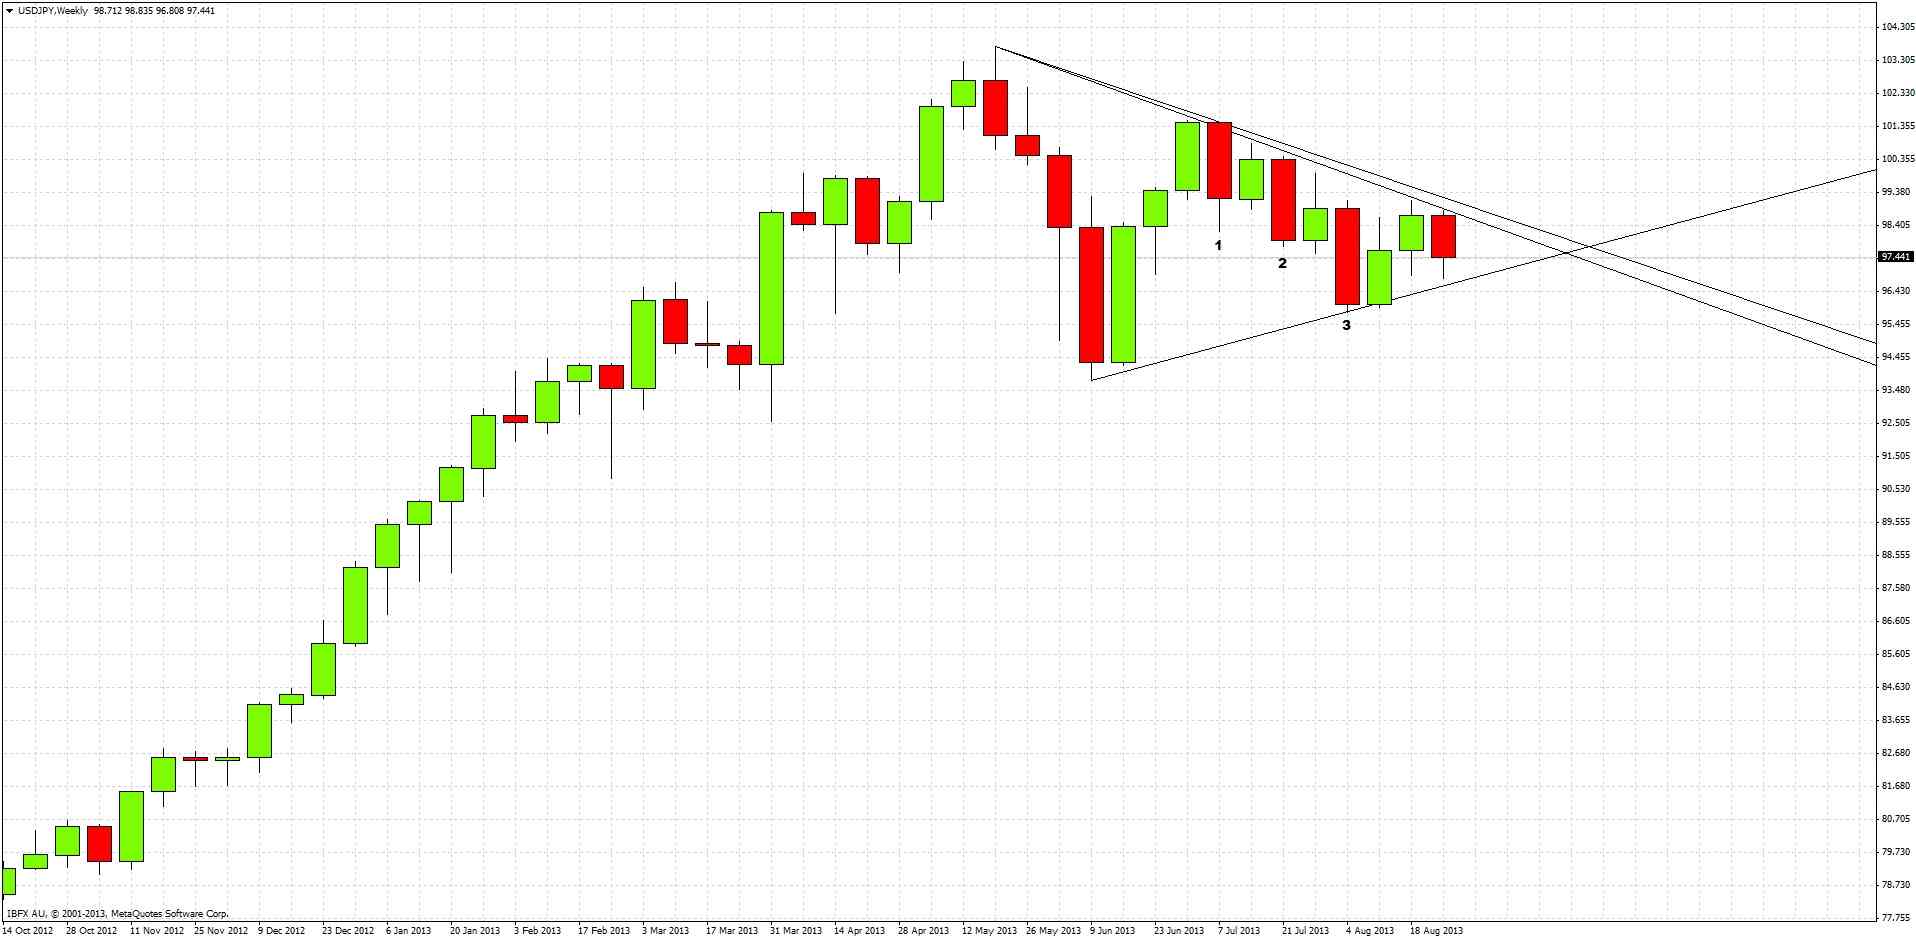
It is very hard to predict which direction the eventual breakout will be in, but the technical evidence points towards a bearish breakout to the downside, i.e. a strengthening of the JPY (several other currencies are also in triangles against the JPY). If you go back to the weekly chart, you can see we have had three bearish reversal closes recently (marked 1, 2 and 3 in the chart below). There has not been a bullish reversal since June.


