Last Tuesday's analysis ended with the following predictions:
"Overall, bullish momentum is strong, but the resistance zone overhead is very heavy and is probably going to take a few attempts to break. If and when the price finally clears 0.9350, the psychological impact for market bullishness on AUD is going to be very big. In the meantime, there should be some good shorting opportunities, maybe off 0.9287 tomorrow or on future days (the longer until it is tested again, the better). Not far above that 0.9317 and 0.9337 are also probably going to give up some short pips if handled correctly.
In the very short-term, 0.9216 could be a good level for a long with a conservative profit target. A more productive long might arrive off a bounce at 0.9070 – 0.9055 which has switched from support to resistance and hopefully back again, it was also a weekly high and did not break last week without a fight. Should price break strongly below 0.9055, it will be hard to remain bullish. However, the support from 0.8845 to 0.89 looks very strong and would be a great place for another long, even if we do go back down there.
Right now, this pair can be seen as the heart of forex action, although that award should really go to USDJPY. This is because the resistance and support levels have been well respected, giving great trading opportunities. In particular, the heavy resistance overhead from 0.9287, is very likely to give traders some great opportunities to make money."
This was quite a complicated forecast so let's review it piece by piece:
1. The level at 0.9287 was not a good level to short, this did not work out well.
2. The level at 0.9317 gave almost 40 pips short as soon as it was hit without any draw down at all.
3. The level at 0.9337 was exceeded by 16 pips, and then gave a maximum 117 short pips.
4. The level of 0.9216 was not quite hit, the price stopped at about 6 pips before that, which was unfortunate as at the time of writing such a long trade would have been up about 125 pips.
It was correct to see this as a hot pair to trade and the action is still lively. Let's see what might be in store and take a look at the weekly chart
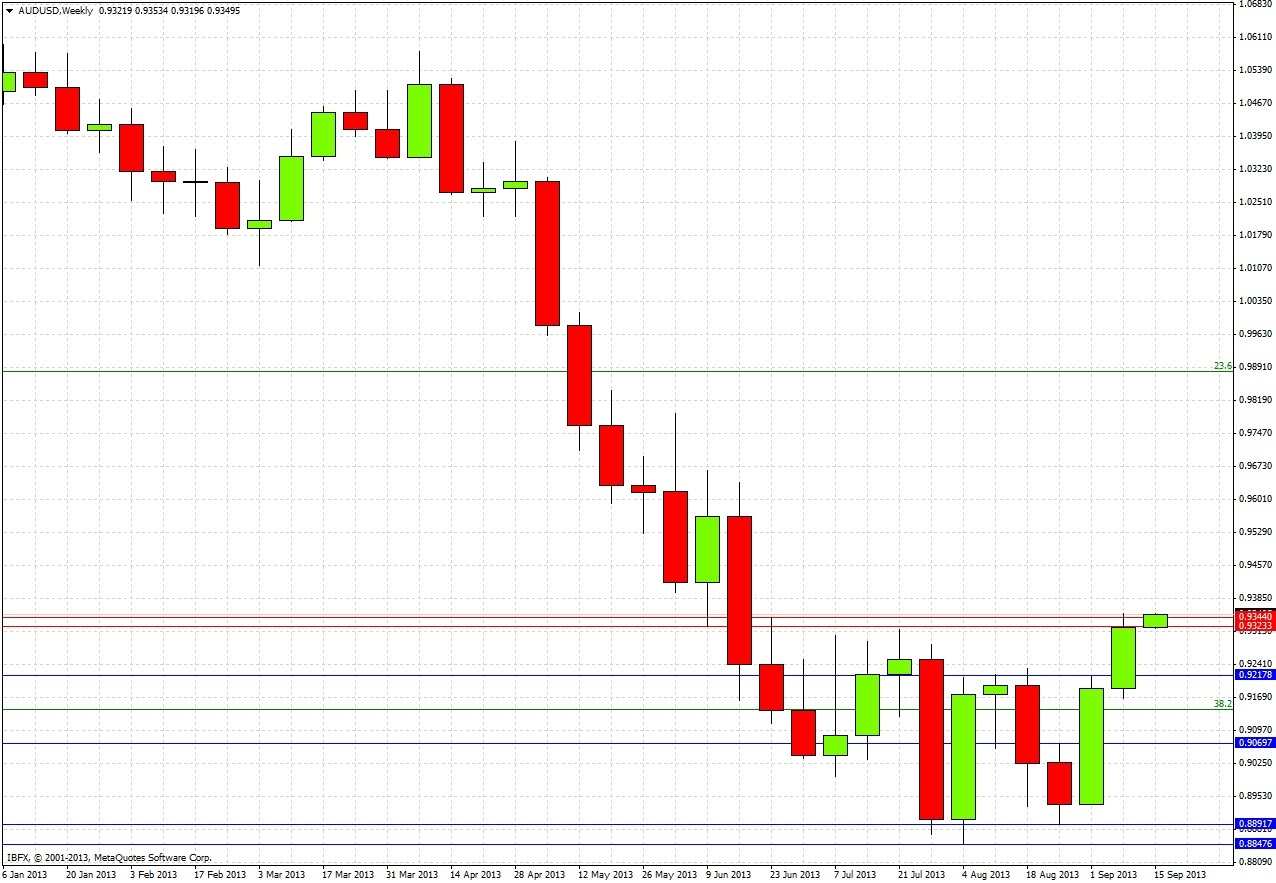
This weekly chart shows that after the previous week's bullish reversal candle, we had another bullish week with a close very close to its high: a bullish sign. The close was also above 0.9300 which had previously contained an area that the price had struggled to break through. The week ended with the price closing just on the lower end of the resistance zone from 0.9344 to 0.9323.
Let's get some more detail and take a look at the daily chart
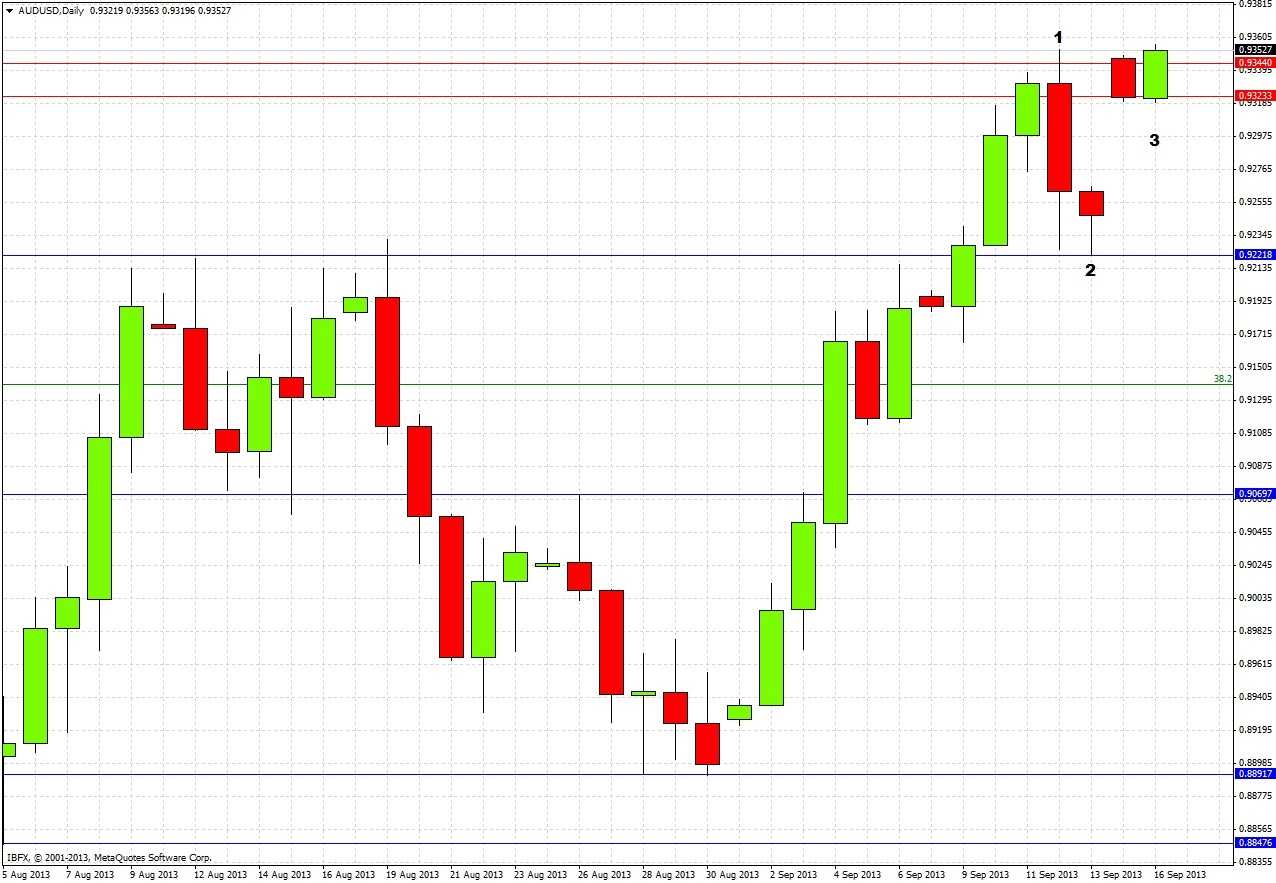
The week began with three bullish days, then the price seemed to just about penetrate the top of the resistance zone at 0.9344 before falling sharply and printing a bearish reversal candle (1). The next day the low of the previous day's bearish reversal candle effectively held, being breached by only 3 pips before the price moved up again (2). The market opened in Australia last night with a strong gap up (3), and at the time of writing the price has bullishly broken the level of 0.9350.
Due to the gap, the only firm conclusion we can draw is that the support at 0.9223 looks solid, especially as it was previously confirmed as resistance twice by bearish candles during August. Aside from that, the breach this morning of 0.9350 and the general action suggests that this pair is firmly bottomed out from its long-term bearish trend. Apart from the gap, there is no obvious resistance standing in the way of this pair reaching 0.9550 – 0.9600.
However, gaps caused by news such as this one do tend to be filled and right now it would be somewhat hasty to buy this as a breakout. The area close to 0.9223 looks like a much more attractive point to go long following a pull-back.
It could be however that the price will simply continue to rise to 0.9550 – 0.9600 now.
It is very difficult to make any predictions beyond these observations, but an overall bullish bias definitely makes sense.


