Last Thursday, our analysis ended with:
"Volatility in this pair has become very low and the rewards for winning swing or position trades also tend to be very low. It is possible to be bearish now early, but technically it is premature. Again, we have to wait for a daily close below 1.33 to be properly bearish or above 1.3415 to say with confidence that the uptrend is taking off again. These are the key levels.
A small move up followed by a successful break of the lower trend line could be the confirmation for a short position trade."
The same day we had a close below 1.33 and the action has been bearish since then, although the volatility has been very low. The key parts of the prediction were borne out by events since then.
Now that we are in a new month, we should begin by looking at the monthly chart
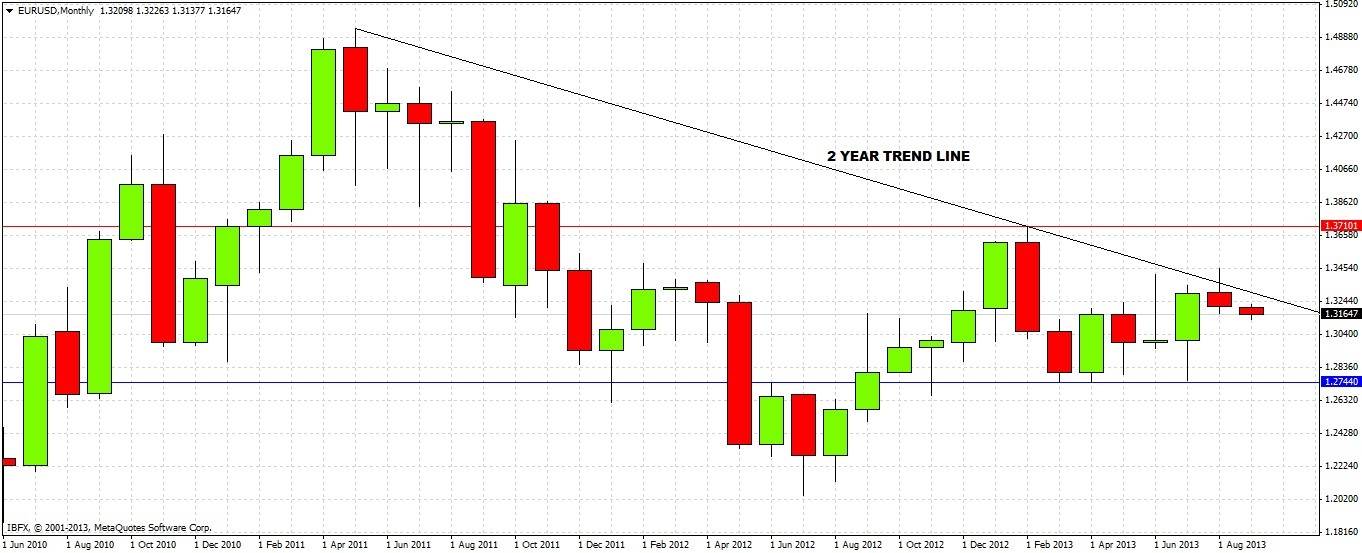
Last month ended as a bearish candle off the unbroken (in this time frame) 2-year long-term bearish trend line. It was the lowest monthly range of recent years. The most recent reversal candle occurred 5 months ago with support at 1.2750, two months before that there was a bullish reversal candle with resistance at 1.3710. This pair has been consolidating within this 960 pip range and shows no sign yet of breaking out of it in either direction. However the recent month's action and the bearish trend line holding can give us a weakly bearish bias on this longer term time frame.
Let's take a look at the weekly chart:
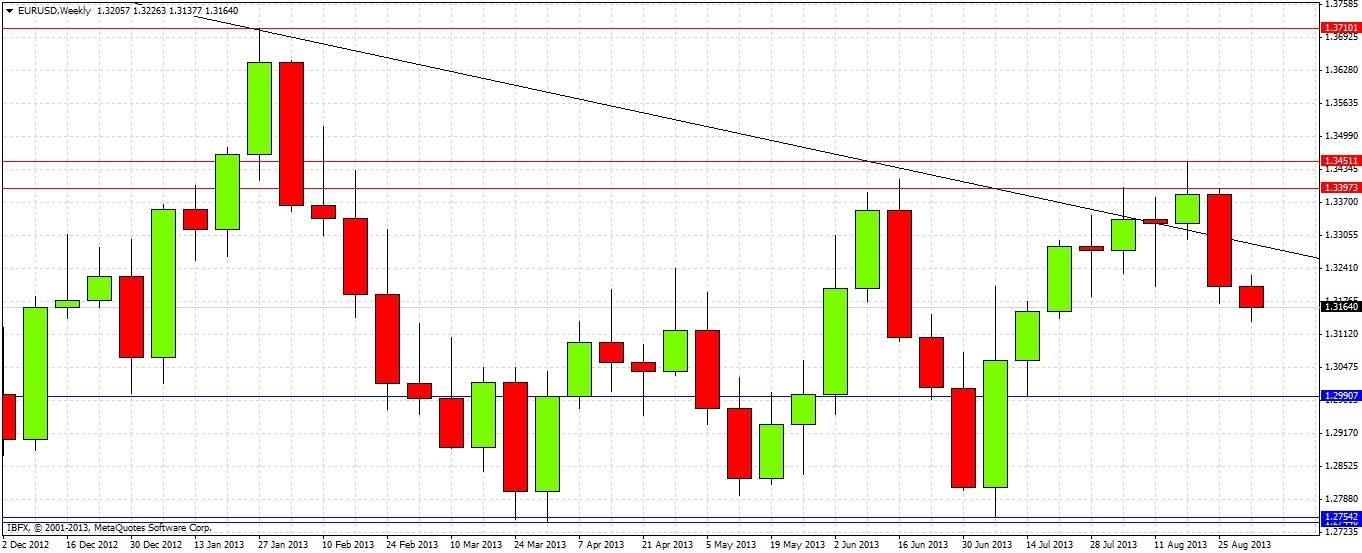
Last week was a bearish reversal candle, giving more weight to bearish bias. The price reversed at a significant resistance zone between 1.3397 and 1.3450. Last week closed below the lows of previous bullish weekly reversals, and we are now entering the zone of a bullish inside week. From 1.3177 to 1.2992. This may act as support, especially at its lower level around 1.30. Below that, there is strong support between 1.2800 and 1.2750.
Let's drill down and look at the daily chart:
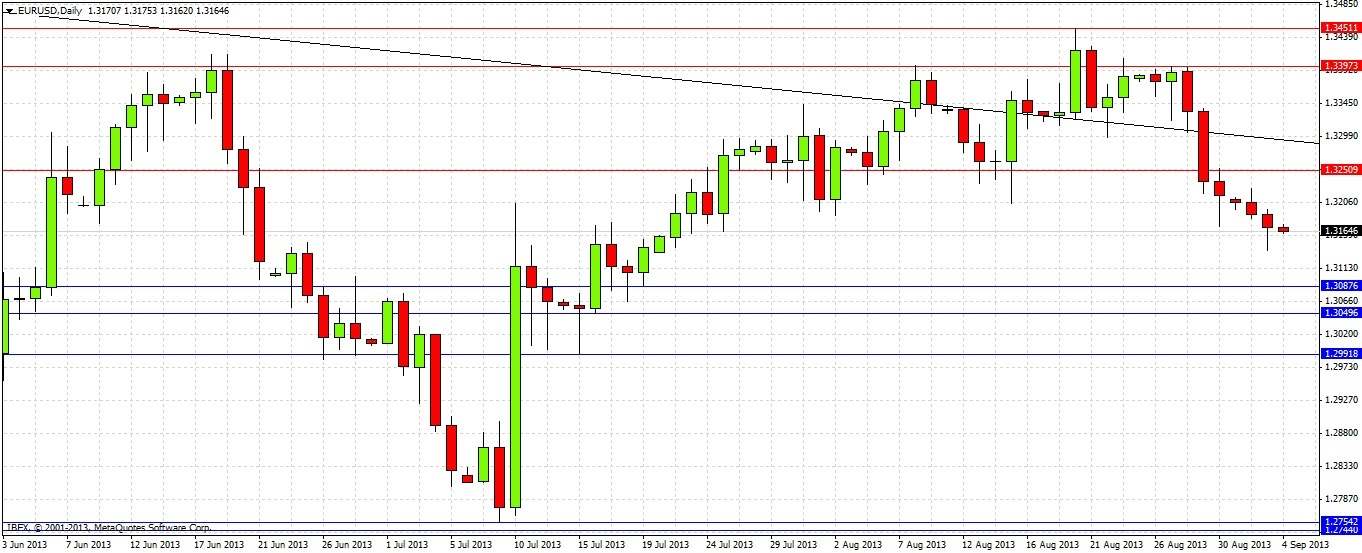
The daily chart above shows the bearish reversal happened last Wednesday and since then every day has closed down. We bounced off a previous 80 day high at 1.3415 and when these time channels are respected they often act as major reversals. The most important thing we can take from this chart is the near resistance level at around 1.3250. Looking to the left it can be seen that it acted as support over several days, before turning into resistance last Friday. Apart from that, the daily chart adds little, except to emphasise that the strongest near support level is likely to be 1.30. The chart also shows two levels likely to act as weak support: 1.3088 and 1.3050.
Overall there is a bearish bias. The best opportunity seems to be a potential short off any reversal at around the key support/resistance level at 1.3250, which is also a psychological level. The next best thing looks to be a potential long off any reversal at around 1.3000, another psychological level with support. Otherwise, we are likely to grind down slowly, encountering support at the minor levels just below. We may well get a bounce up to 1.3200 or higher before we get near 1.3000. Overall, a bearish bias until 1.3000 unless something important changes.


