The analysis from Wednesday the week before last can be summarized as follows:
1. If the price rises significantly without making a new low, then probably the existing low will hold, however it is most likely that we have not seen the low yet and there will be a new low.
2. A new low between 1.0245 and 1.0260 is likely to lead to a major move up and as such is a good zone from which to go long.
3. It is best to hold onto any existing long trades.
4. The low at 1.0245 should not be broken soon.
5. Major news is due later tonight so the price might spike below the support, stops need to widened accordingly.
Twelve days have passed since this prediction, but let's look at the daily chart since then to see how things turned out:
As the forecast correctly anticipated might happen, the news later that same evening sent the price shooting down below the low of 1.0245, to reach a low of 1.0181. It cannot really be called a spike as the price did remain below 1.0245 for almost 24 hours, however the price recovered strongly and steadily from these levels. Therefore the overall bullish bias of the forecast was justified, as the price has been broadly rising ever since, and is now at a level above where it was at when the last forecast was published. The unexpected news from the Fed about tapering certainly blew 1.0245 out of the water for several hours, showing how unexpected news can destroy any technical trade very easily.
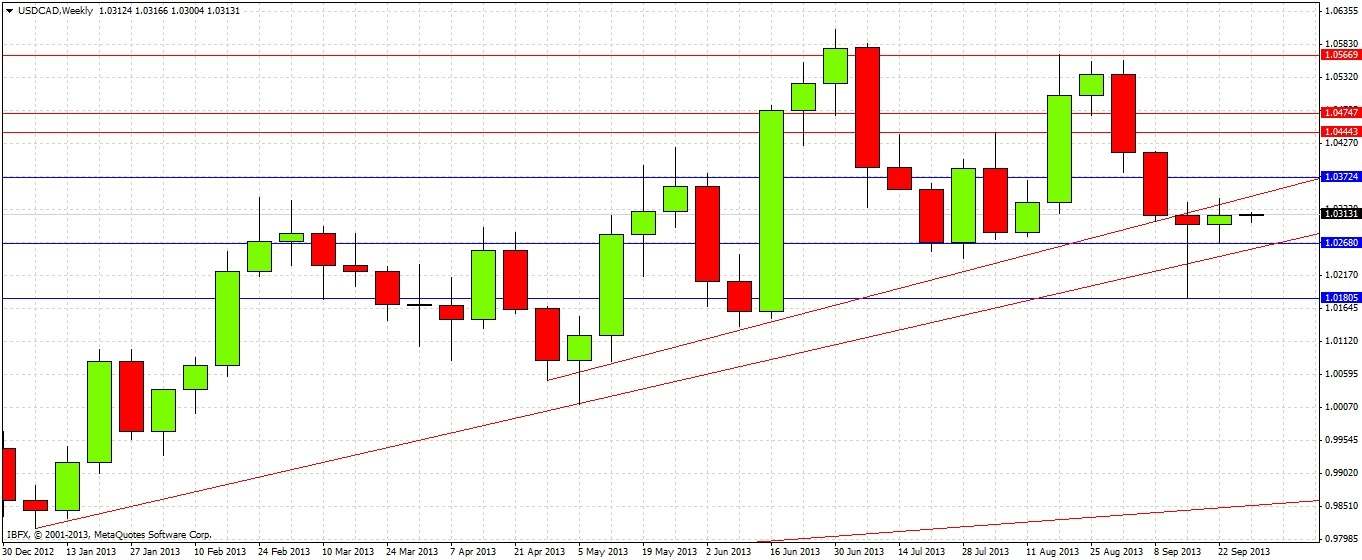
Turning to the future, let's start by taking a look at the weekly chart
We can see that the week before last – the week of the big news – produced a bullish pin bar that was held by the support of the lower bullish trend line. Last week had a very narrow range, in fact from a quick eyeball of the chart there has not been a lower ranging week for a long time, so the fact that it was just about a bullish reversal should be discarded. Due to last week's quietness in the Forex markets, it is hard to judge whether there is real resistance at around 1.0314, or whether the market has simply not had the momentum to move up.
The weekly chart shows a bullish picture that will be confirmed by a closer look at the daily chart:
The daily chart shows that after the pull back at the beginning of last week, there was a bullish reversal candle (1), which established the low of last week at 1.0268. This level could act as good support.
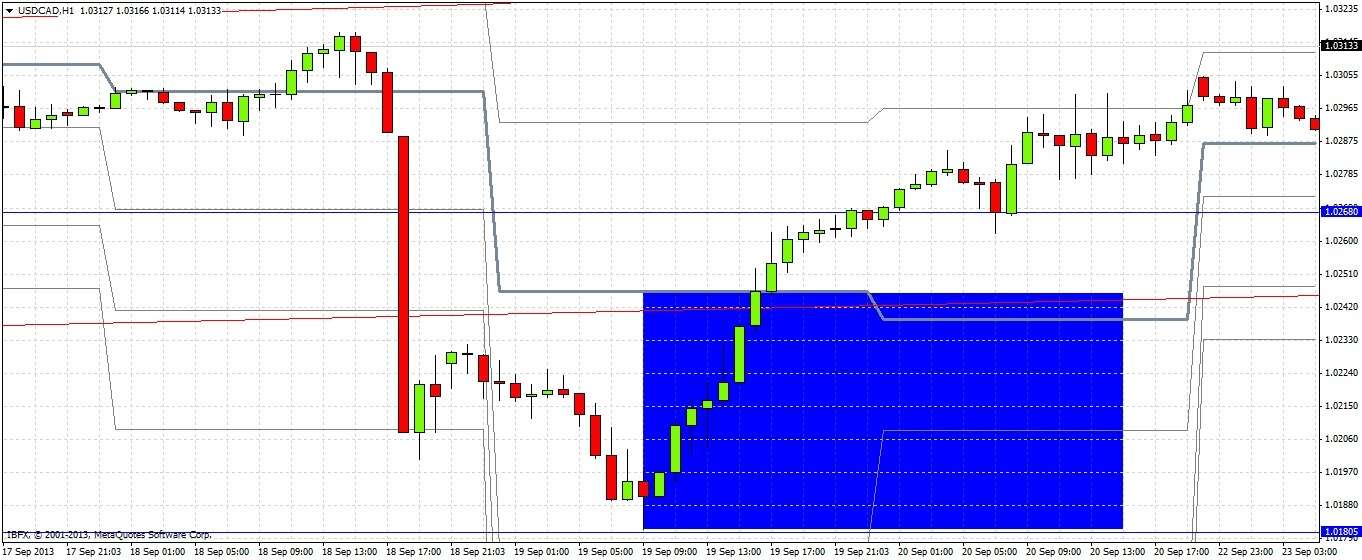
It is worth dropping down to the 1 hour chart for a close look at the bullish comeback after the dramatic news from the Fed, when the price bounced back from its low of 1.0181:
The blue shaded area shows strong and steady buying up to about 1.0250. The price has not reached these levels again, so we can conclude that there was lots of demand down here. We should get some kind of bounce up if and when the price returns to levels below 1.0250. In fact, we got strong support at 1.0268, so that would also be a level to look for a long at any bullish reversal.
Overall, the picture is a bullish one, the problem is that it is hard to see where resistance is likely to be, but there is no technical reason not to have a bullish bias.
It can be recommended to go long below 1.0250, or at a bullish reversal from 1.0268. If the price does not break 1.0340 in the next few days, we should get a retest of 1.0268.
A daily close significantly below 1.0250 would be a good reason to abandon bullish bias.


