Our previous analysis on Wednesday last week ended with the following predictions and recommendations:
1. There is a possible great shorting opportunity, if today's candle closes below 0.9650 and near its low, short at break of daily low tomorrow as this would be a very bearish sign.
2. Take at least a partial exit of any open longs recommended.
3. It is probably going to take some time to break through the confluent resistance around 0.97, if at all.
4. Look for longs at next pull back to 0.9527, but watch the momentum of the price when that level is reached for more information about whether this is wise.
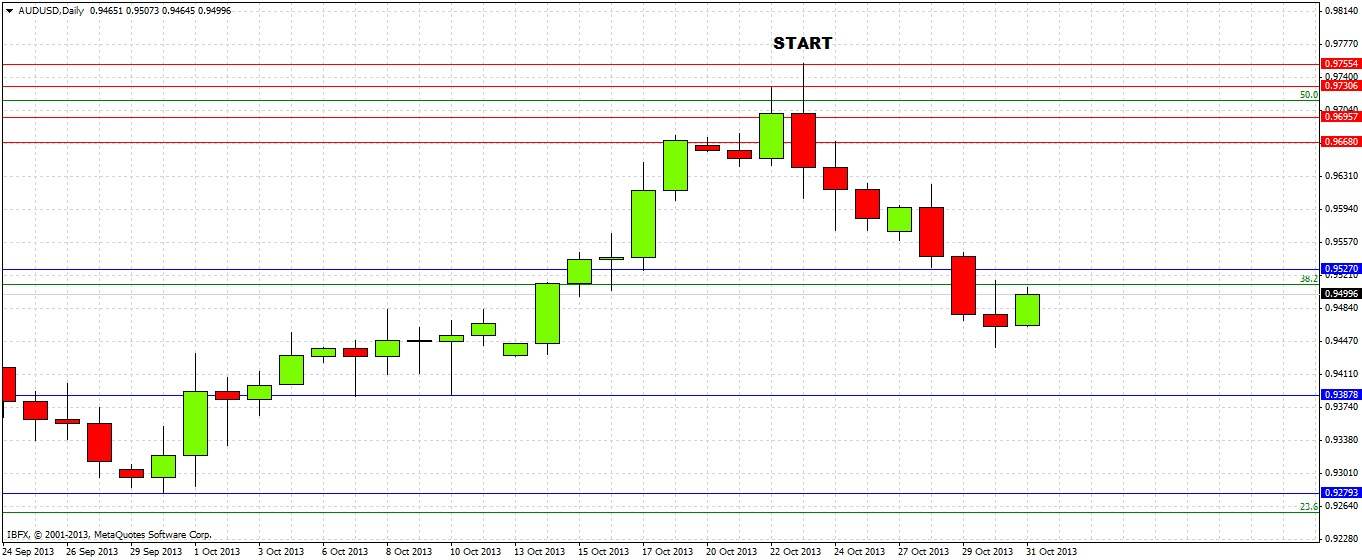
These predictions worked very well, with one or two problematic issues, as can be seen by taking a look at the daily chart:
We correctly called the bearish turn at the confluent resistance around the 0.97 level. Although that daily candle did close below 0.9650, it did not close very close to its low, and not within the bottom quarter of its range. If you did go short at the next day's break of that low, you would be in profit now and have already had an opportunity to take 160 pips.
Going long at 0.9527 was not such a great call, however we did say this should be watched and on the hourly chart there was no suitable candle signaling a long off this level.
All in all, it was a very effective analysis.
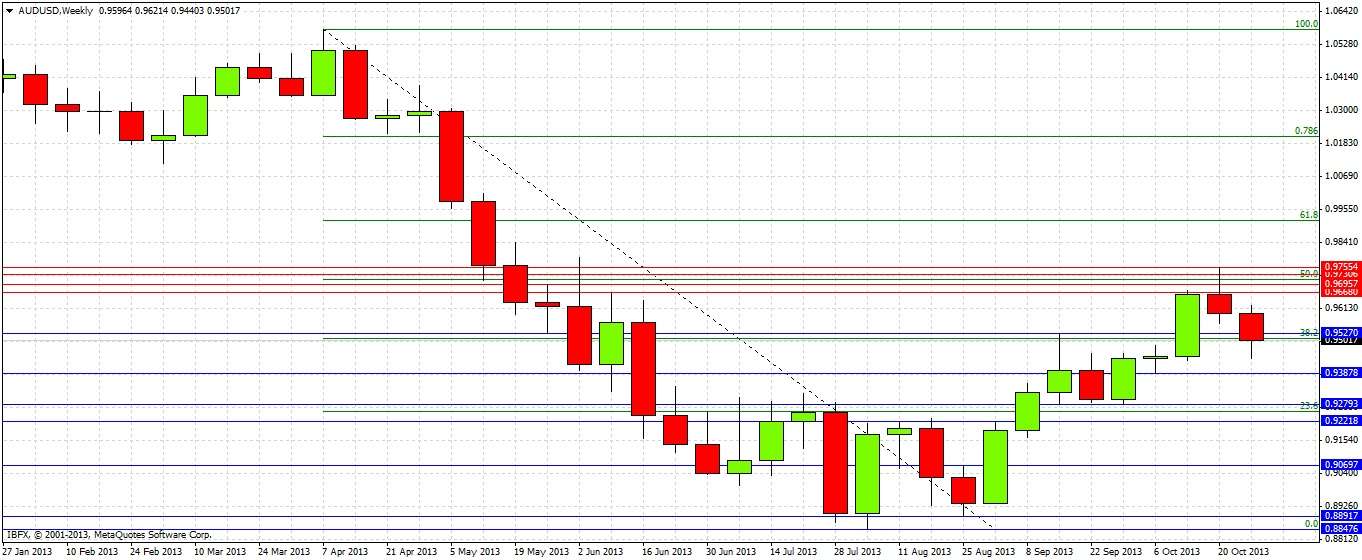
Turning to the future, let's start with a look at the weekly chart:
Last week produced a near-bearish pin bar. This week has also been bearish, although it still has not broken the low of the last bullish candle.
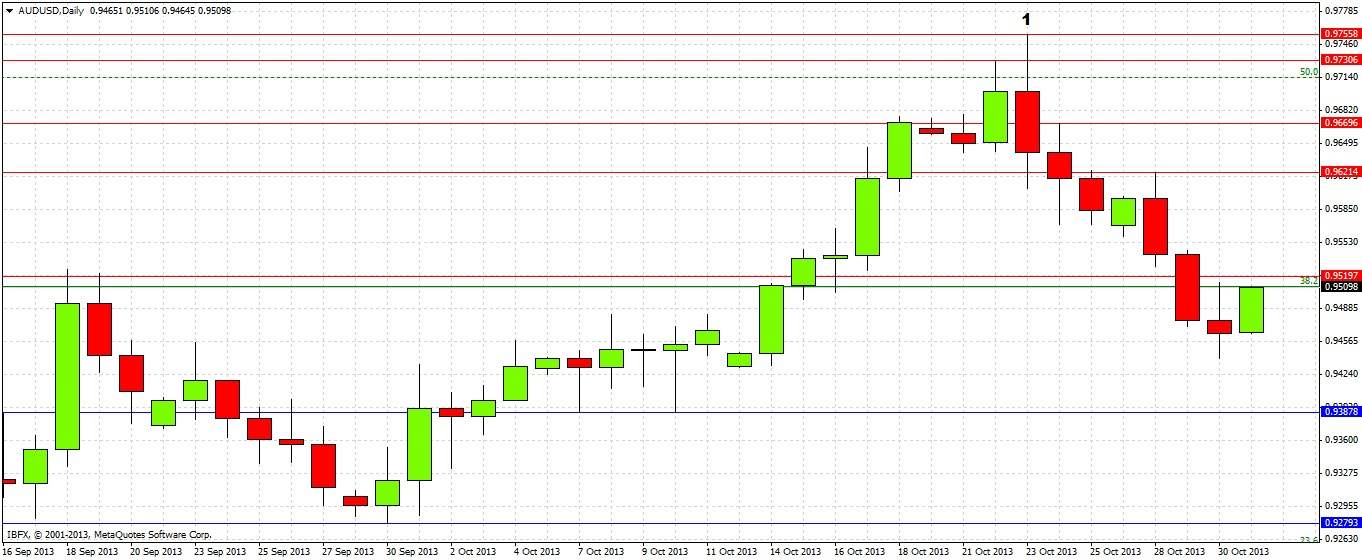
Let's try to get some more detail now by taking a closer look at the daily chart:
Action has been solidly bearish for more than a week, with 0.9756 being established last week as strong resistance by the daily bullish reversal candle marked at (1). Every single day since then has closed below its open. There is a zone of daily and weekly highs and lows confluent with a 50% Fibonacci retracement of the recent long-term down trend stretching from about 0.9756 to 0.9670.
On Tuesday we broke below the 38.2% Fibonacci level, but in the process a minor S/R level at around 0.9520 was established. It will be useful to see whether this level/zone is broken to the upside today.There are strong support levels remaining quite a way below at 0.9388 and 0.9279.
From this analysis we can make the following predictions and recommendations:
1. It is quite likely that this week's low has already been established.
2. There is support from approximately 0.9425 down to 0.9388 that will come into play and be a good zone to look for long reversals on the shorter timeframes.
3. There should be another good short off the next return up to the strong resistance at 0.9670, that zone formed by the confluence stretching up to last week's high is not going to be broken any time soon.
4. In the unlikely event of a strong break below 0.9388, this would be a very bearish sign and we should reach 0.93 fairly quickly after that occurring.


