Last Wednesday's analysis ended with the following predictions:
1. Price should go higher over next few days, so we should have a bullish bias
2. Retraces to 1.3650 are good opportunities to go long
3. Resistance zone exists from 1.3830 to 1.3860, unlikely to be broken today
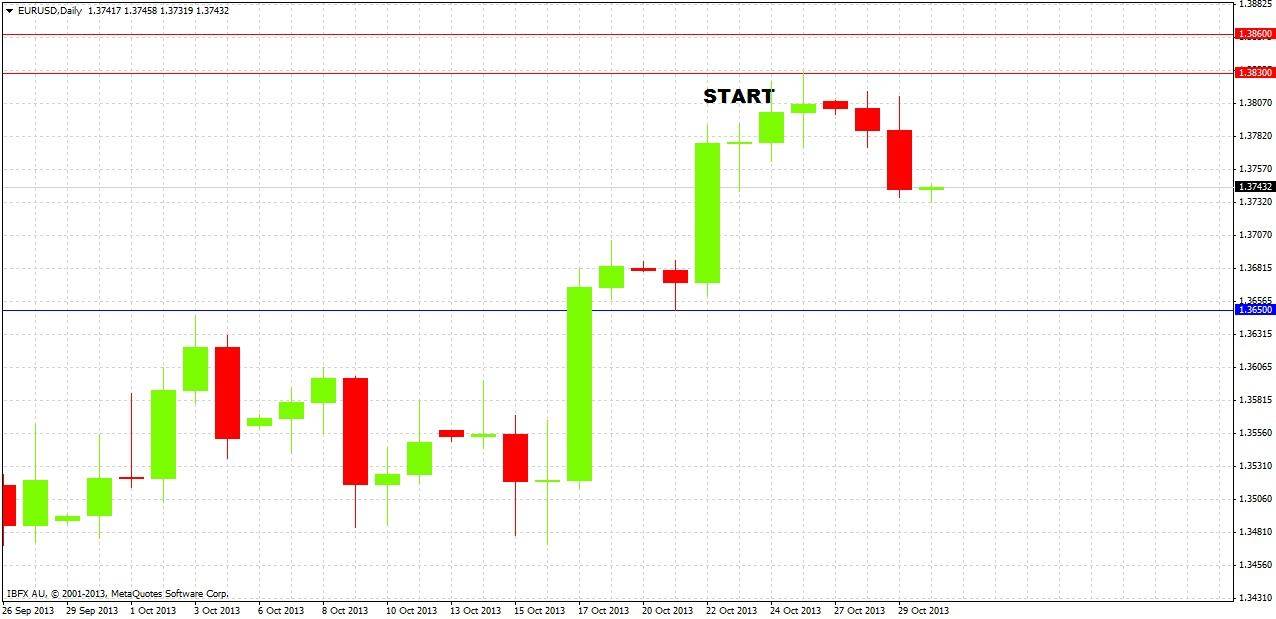
Let's take a look at the daily chart to see how things actually turned out:
This was an excellent prediction. The price did go higher over the next few days, breaching the lower level of the resistance zone at 1.3830 by just 2 pips before falling. Unfortunately there was no pull back to 1.3650 for a long. It would have been even better if we had recommended a short at 1.3830, although the price has not fallen by very much since then.
This prediction at least would have kept traders out of trouble and got them out of any longs at the very top of the bullish move so far.
Turning to the future, let's start by taking a look at the weekly chart below:
Last week was a solidly bullish candle. So far this week has been a bearish inside candle. The bullish momentum was not able to penetrate beyond 1.3830 – 1.3860 as these were weekly highs when price was last in this area, and there is confluence here with the 61.8% Fibonacci retracement of the 2011-2012 large, long-term down move. As expected, it will take some consolidation for this zone to be breached to the upside, if at all.
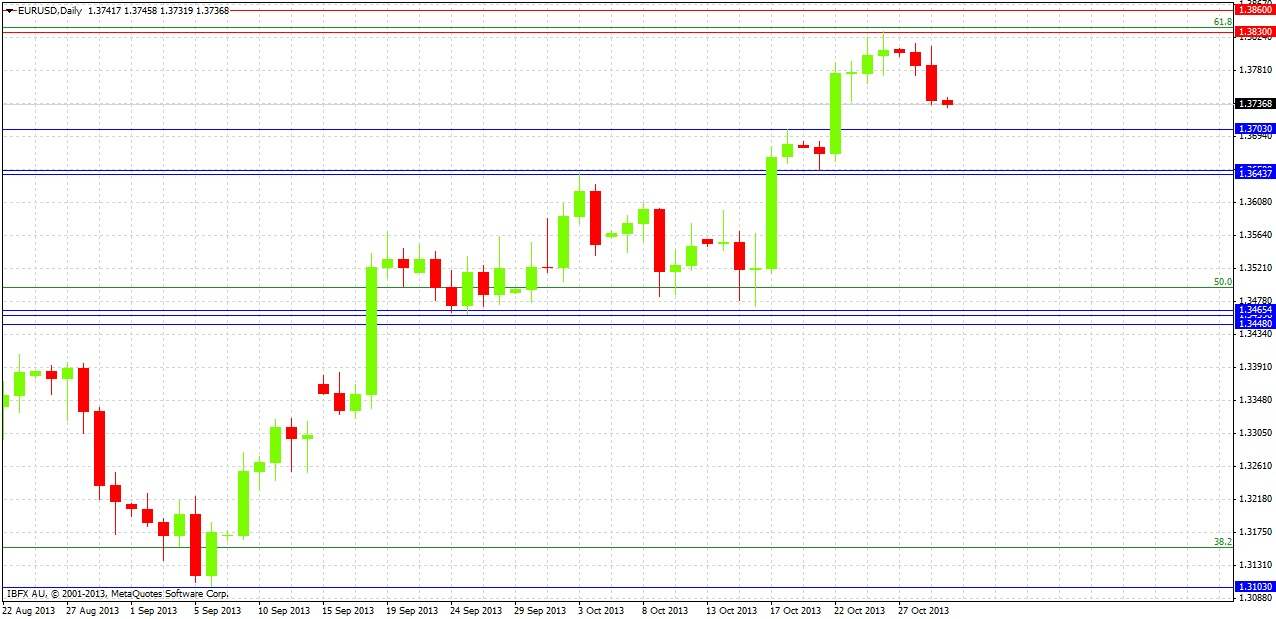
Let's drop down to the daily chart again to try to find some more details:
The daily chart shows that Monday printed a bearish reversal candle, and yesterday’s candle was also very bearish. Looking at the pattern of the last several days, it looks like we have had a distributive sell-off at areas around 1.3800. However there is probably plenty of demand remaining at 1.3700 and below.
The chart is showing a stall in the uptrend, with strong resistance at 1.3830 but also very clearly defined support zones at 1.3650 and around 1.3500.
The uptrend may reverse now, or simply pause. As we are likely to have some consolidation with unclear direction, trading off S/R would probably be the best bet until we get some clearer direction. Recommendations are:
1. Longs are possible off short-term bullish reversal candles touching 1.3703, or fast moves that touch down to 1.3650.
2. Shorts are possible at retests of 1.3830.
3. Should the price decisively break above 1.3860, this would be a highly bullish sign that we are going up to 1.4200.
4. Should the price decisively break below 1.3640, this would be bearish sign that we are going to approach 1.3500.
5. A long close to 1.3500 should be a good trade.
6. It is unclear how strong support is at 1.3703, but the other levels marked should all be strong.


