Our last analysis on Monday last week can be summarized as follows:
1. If 1.0339 is not broken to the down side today, that is a sign that the upwards trend may be ready to resume
2. Overall bias is still bullish but the upwards trend may well be faltering
3. If the price returns to 1.0268, this may be a good point to go long, especially if there is confluence with a bullish trend line or lines
4. A rapid retest of 1.0418 may be a good point to go short
Let's look at the daily chart since then to see how things turned out
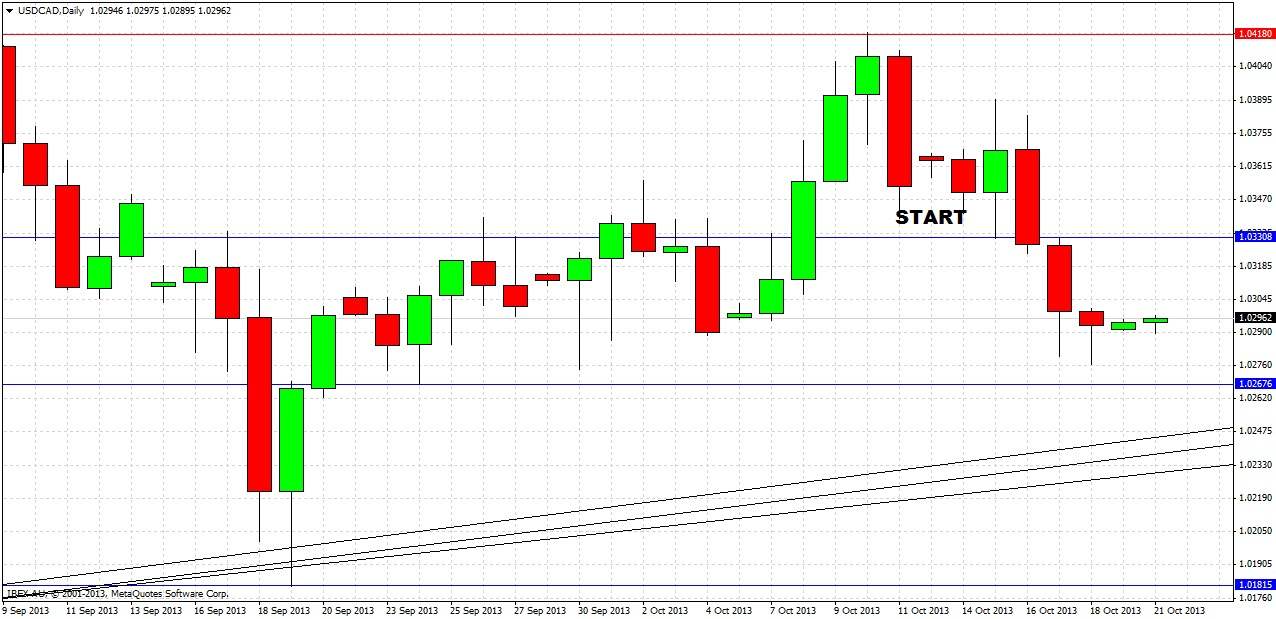
The primary move has been downwards. In spite of the 1.0339 level holding for the first two days following the previous analysis, the upwards trend has not yet resumed. Having said that, the upwards trend has not been broken either. We did mention the trend might falter, and it has. Neither of the levels mentioned (1.0268 and 1.0418) have been tested yet.
Turning to the future, let's start by taking a look at the weekly chart
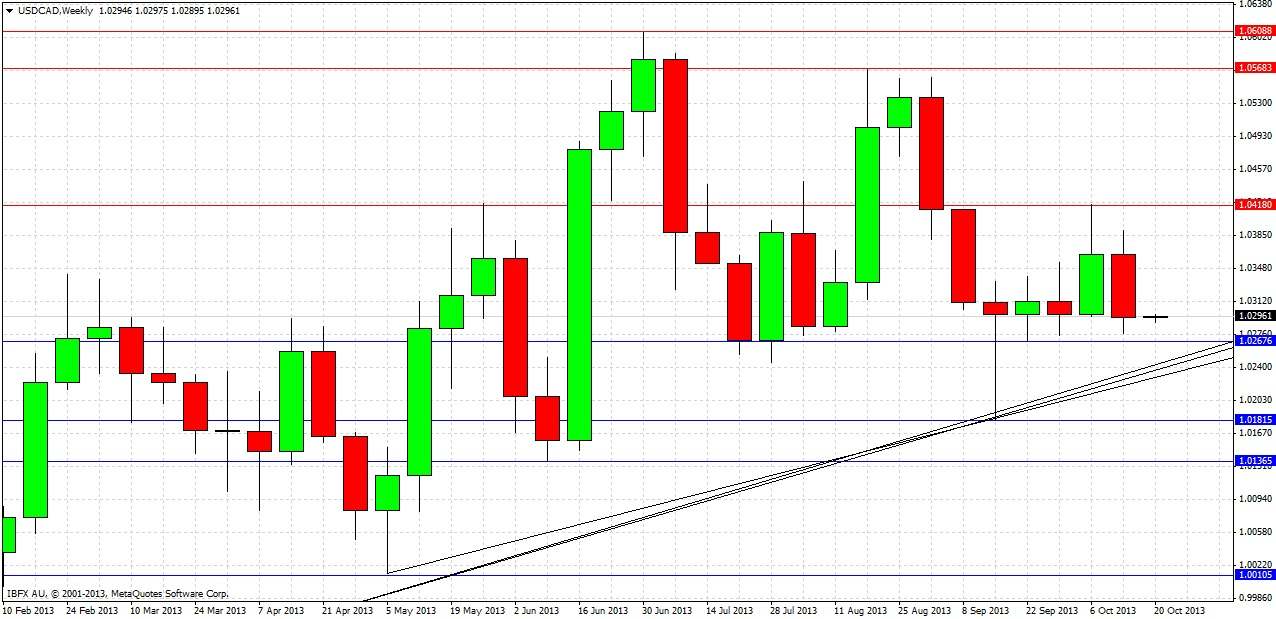
Last week was a bearish reversal candle, following the previous week which was a weakly bullish reversal candle. It is plain to see that the past few weeks have been a period of slightly bullish consolidation with the price not really going anywhere. Significantly, the support at 1.0268 has held, and we have approaching bullish trend lines, although the price has not really been able to rise much yet, if at all.
Let’s take a closer look now at the daily chart to try to get some more clues as to future direction:
Last Tuesday produced a very weak bullish engulfing candle, marked at (1). This was immediately reversed the next day by a strong bearish reversal candle, marked at (2). This bearish sign heralded a further modest fall, but the downwards momentum slowed as the price approached 1.0268, as we can see in the lower wicks of the last two bearish daily candles.
Before making the next forecast, as the price is quite narrowly balanced right now, it is helpful to try to pick up a few clues from the hourly chart
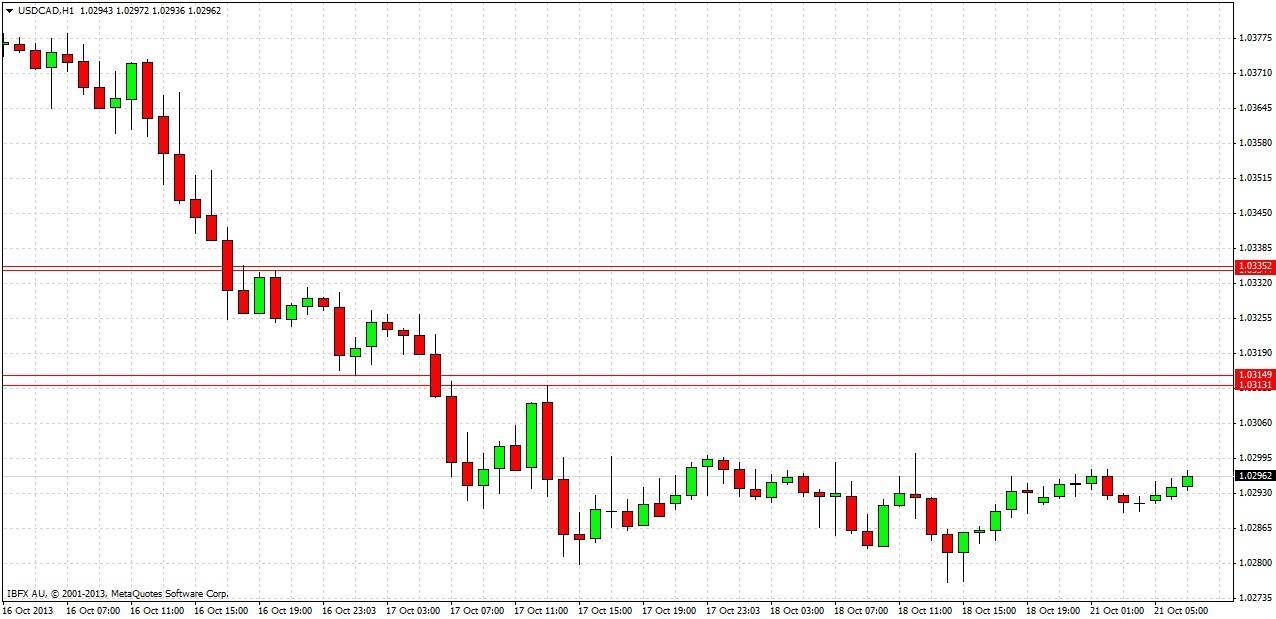
There are two resistance zones overhead that can be identified from the 1 hour chart: the closest is at 1.0313-15, there is another one at about 1.0334-39. Watching whether these hold or are strongly broken to the upside will be indicative of whether the upward trend is likely to get going again.
Finally, turning to our forecast for the next week, little has changed from last week. The uptrend has no momentum but there is certainly historical support at 1.0268 and below, and at the bullish trend lines which are approaching. The level at 1.0268 still looks like a good place to get long. If we get some upwards momentum from there, this could be a low-risk, high-reward point to get long. The local resistance levels identified in the last paragraph should be good indications of how things are going. However, a daily close below 1.0250 and the bullish trend lines will be a very bearish sign that the uptrend is likely to have ended.


