Since early 2012, volatility in this pair has declined dramatically, making it harder to trade profitably. This was quite a change as during 2010 and 2011, EUR/USD was one of the most volatile pairs. It also “behaved” quite predictably technically, especially regarding candlestick analysis. These factors, and its low spread, made it the number 1 choice of instrument for retail Forex traders.
The decline in volatility that occurred during 2012, and the explosion in the JPY, have led many traders, especially trend traders, to abandon the pair. It has also become somewhat less technically predictable.
These changes have made certain popular strategies that had been profitable become unprofitable. However, there are two closely related strategies I detail below that are still widely followed and regarded as robust. One note of warning: I only have limited historical data regarding the performance of these strategies, so please test them thoroughly yourself before risking any real money on them. I do not “recommend” trading them; only that you consider investigating them if you are looking for a mechanical or semi-mechanical strategy for trading this pair.
The two strategies are both based around the price movement following the London Open, which occurs at 8am London time, and the trading range of the later part of the Asian session. The London Open price is seen as a key level, as is a breakout from the usually relatively small Asian range, which is why I would not be surprised if these strategies back test as solidly profitable over a large period of time. Of course, all mechanical strategies are subject to losing streaks.
Strategy 1 – Retest of London Open after Breakout
At 8am London time, note the high and low prices of the past three hours, from 5am to 8am. From 9am London time until 4pm London time, watch for the first hourly close outside this range. As soon as this occurs, place an order exactly where the price was at 8am London time.
If the first hourly close outside the range was below the range, the order should be a sell limit order to go short.
If the first hourly close outside the range was above the range, the order should be a buy limit order to go long.
The stop loss should be placed just beyond the other side of the range.
There are a number of possible options with profit targets, once the trade reaches a reward to risk ratio of 1:1:
Move the stop loss to break even and aim for a higher target, based on pivot points, obvious support/resistance, or the Average True Range of a number of previous days.
Do not move the stop loss to break even and use the methods outlined in 1. Above.
Use a trailing stop based upon the high or low as appropriate of the previous 3 hours on the turn of each hour.
Consider exiting fully at 10pm London time.
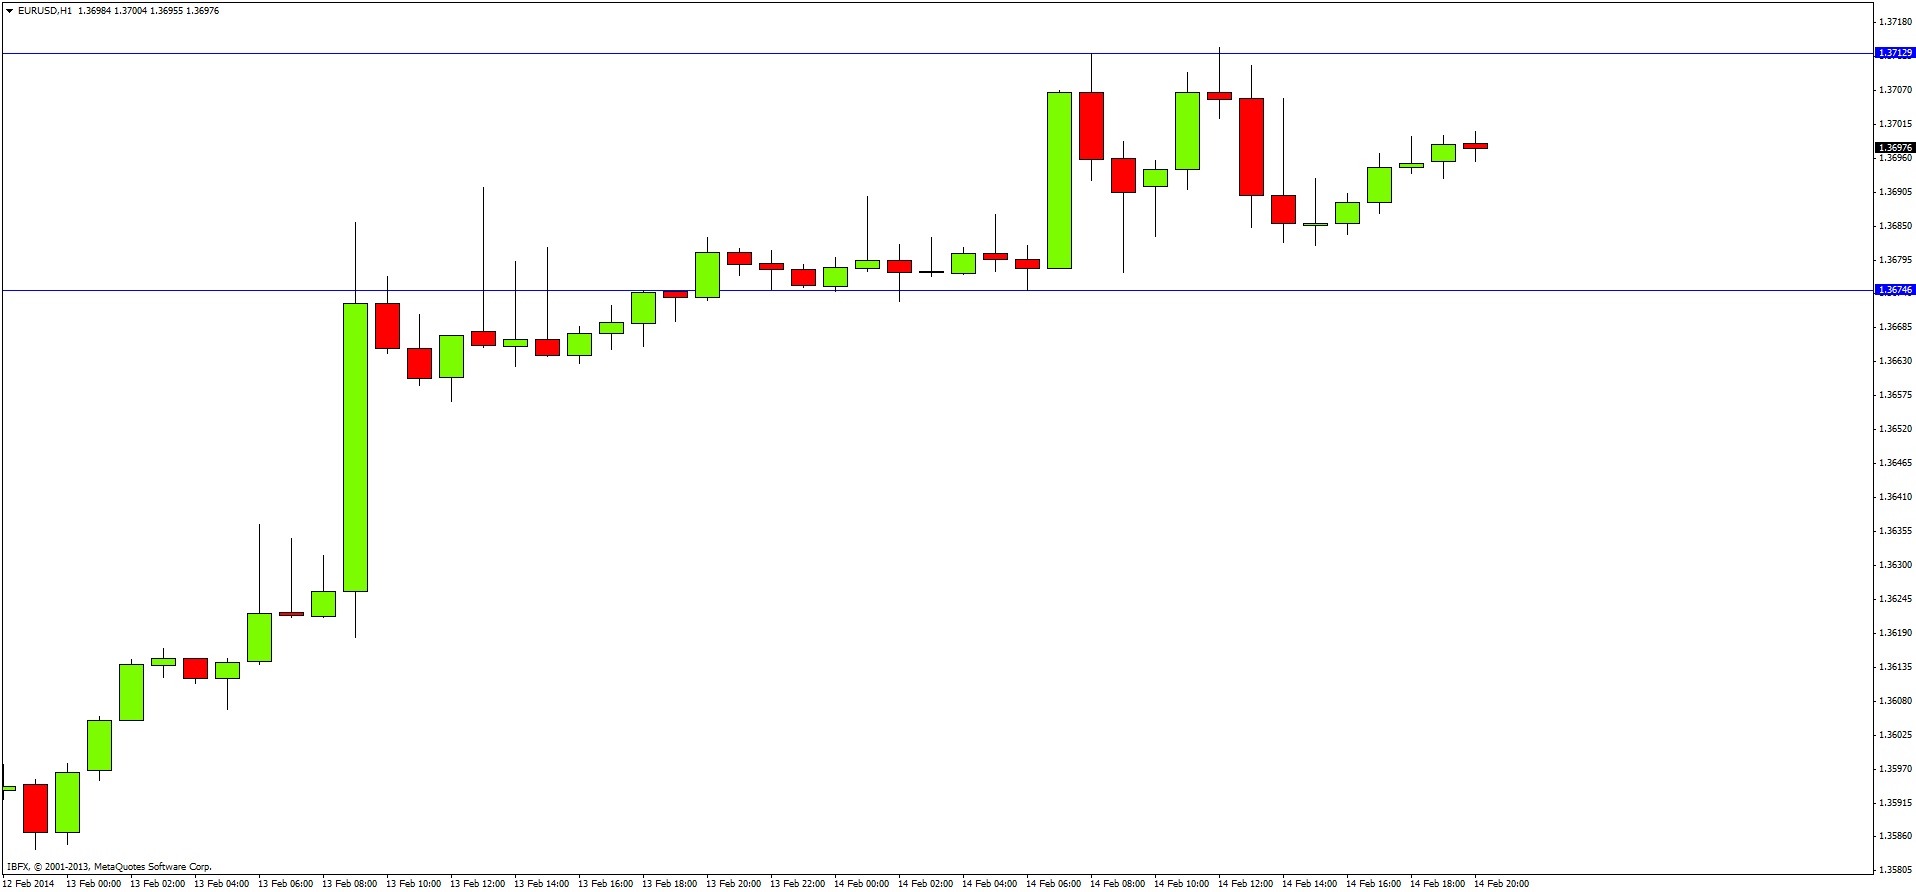
The image below shows how this strategy would have applied last Friday:
The 3 hour late Asian range is defined by the blue horizontal lines. During the day, not a single hourly close occurred outside that range. This is a good example as to how this strategy can keep you out of choppy markets. If an hourly close had occurred above this range during the London session, we would have placed a limit order at the London Open price, with a stop loss 1 pip below the lower level of the range (the lower blue horizontal line).
From May 2011 until the end of 2012, 63% of the entries triggered reached a reward to risk ratio of at least 1:1, which was an impressive record.
One thing that is quickly noticeable from any visual mechanical back testing is that where the range is very bullish, there is a strong probability that a bullish breakout will lead to a good bullish move, and vice versa with bearishness.
Strategy 2 –London Open Breakout with Trend
Use an H1 chart and place the 50 period Simple Moving Average on the chart. Long trades may be taken only above the SMA, and short trades may be taken only below the SMA. Only one trade per day may be taken.
At 8am London time, note the high and low prices of the past four hours, from 4am to 8am.
From 9am London time until 5pm London time, enter with a buy stop order one pip above the range or a sell stop order one pip below the range, whichever one happens first, with the qualification that it must be above the 50 SMA for a long and below the 50 SMA for a short.
If the price breaks the “wrong” side of the range where no trade is placed, do not cancel the order just past the other side of the range until there is an hourly close beyond the “wrong” side of the range.
Once a trade is triggered, wait for the close of the hour following the hour within which the trade is triggered. For example, if the trade is triggered at 9:30am, wait until the close at 11am. The process of managing the trade should begin then, by moving the stop up to the low (if a long trade) or high (if a short trade) of the previous three hourly candles.
If the trade is not closed out naturally by this trailing stop, close any open trade at 10pm London time.
The advantages of using this trailing stop are that it usually keeps you in strong directional moves until the move is exhausted. It also often cuts your loss short on a losing trade that moves at least some minor distance into profit.
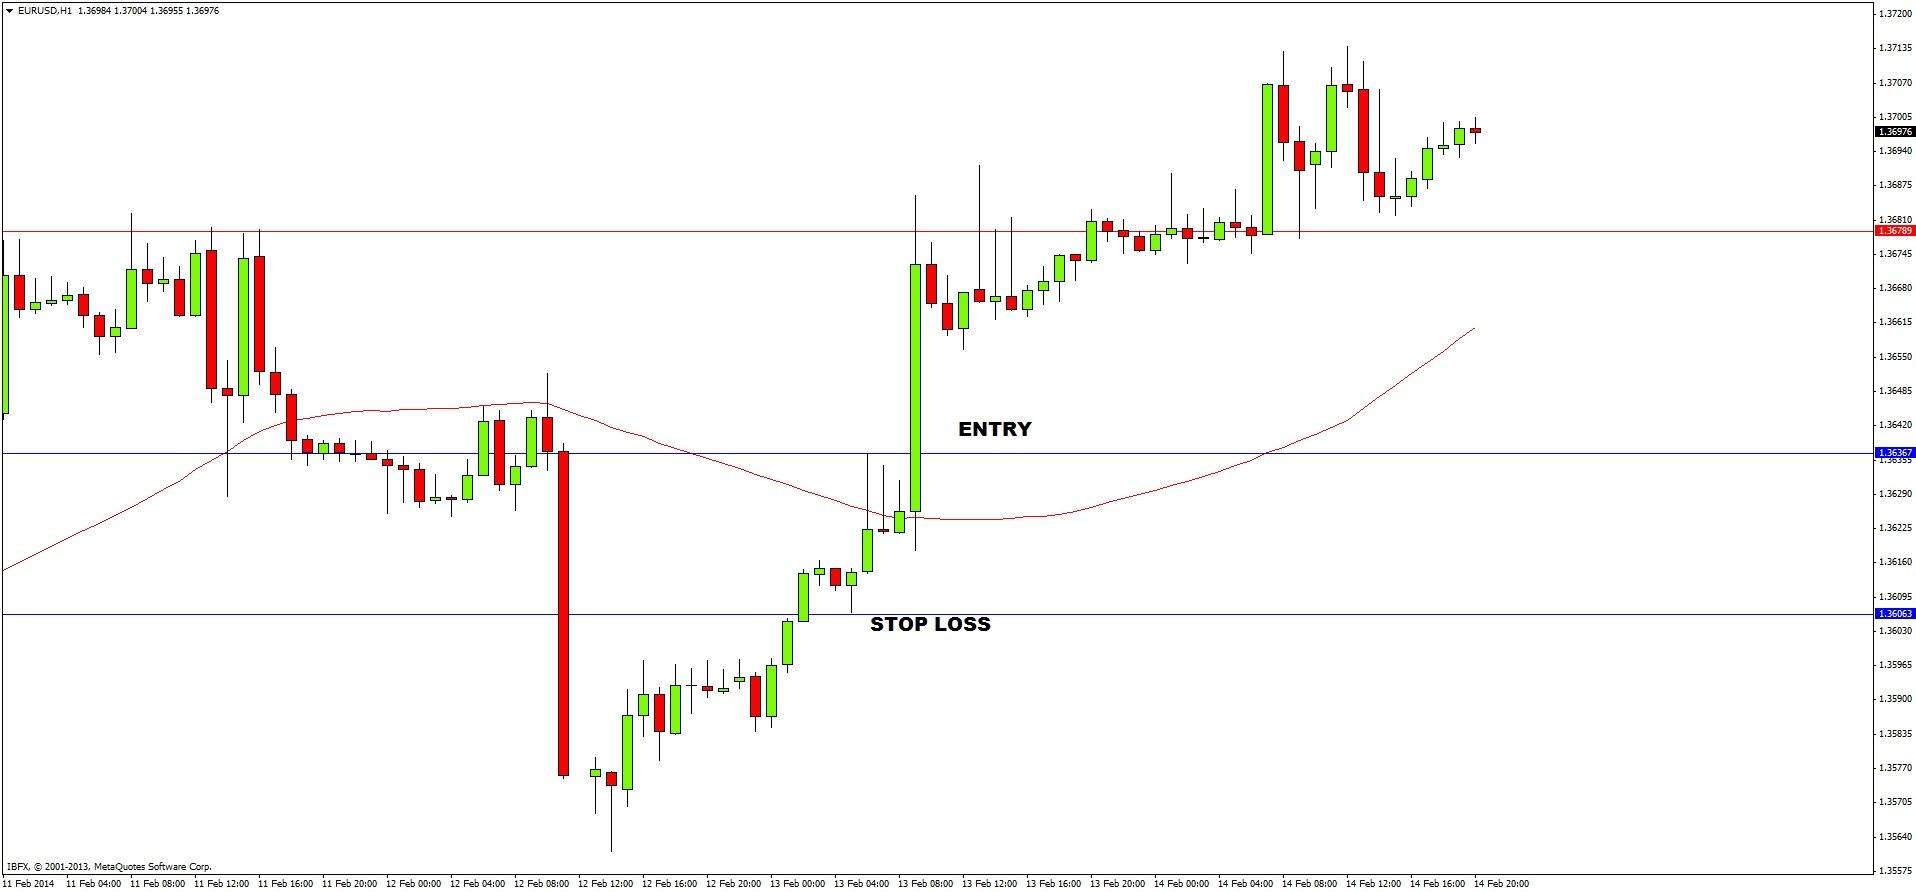
The image below shows an example of a recent trade from Thursday last week:
The range is drawn with the blue lines. A long entry is triggered by the breakout which is above the 50 SMA (the wavy red line). Looking at the subsequent hourly candles, we can see that the 3-candle low trailing stop would have kept us in the trade until 10pm London time at the horizontal red line, for a profit of approximately 1.3:1 reward to risk.
From July 2012 until February 2013, although only 43% of the entries produced profitable trades, each trade made an average profit of 30% of risk. That is a fairly respectable score for any fully mechanical system.
Both of these strategies deserve more serious investigation and back testing. If I am able to do so, I will publish results of such testing in a future article.


