USD/JPY Signal Update
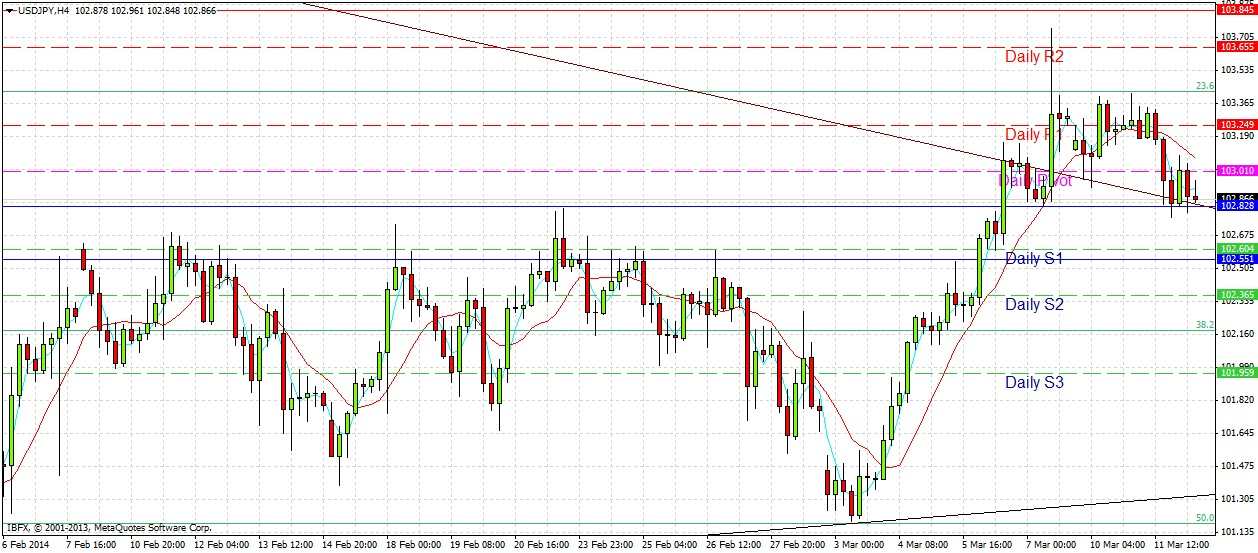
Yesterday’s signals did provide a supportive level that was hit and has far acted supportively, this was the level of 102.83. However the price action at the first touch was not suitable confirmative according to my instructions so no long entry would have been made and this level has been technically invalidated for now. Despite that, I think it is still acting supportively, so I will go into this more deeply below.
Today’s USD/JPY Signal
Risk 0.50%.
Entry may be made at any time up until 8am London time tomorrow.
Long Trade
Enter long following the first next bar break of any bullish pin or engulfing hourly candle subsequent to the first touch of 102.60. From one hour following the close of the first hourly candle that closes above 102.60, this trade should no longer be taken.
Place a stop loss 1 pip below the local swing low.
Adjust the stop loss to break even when the price reaches 103.29. Remove 75% of the position as profit at this level and leave the remainder to ride.
Short Trade
Enter short following the first next bar break of any bearish pin or engulfing hourly candle subsequent to the first touch of 103.84. From one hour from the close of the first hourly candle that closes above 103.84, this trade should no longer be taken.
Place a stop loss 1 pip above the local swing high.
Adjust the stop loss to break even when the price reaches 103.45. Remove 75% of the position as profit at this level and leave the remainder to ride.
USD/JPY Analysis
We are currently poised at a crucial point. The price is just sitting on and retesting the broken bearish trend line which is confluent with the supportive level identified at 102.83. We had a weak bounce up from this level during the Tokyo session of about 25 pips, and we may well be at the start of another firm move up. If this level does not prove to be supportive then the next likely candidate is 102.60 so I am giving that level as an active place to look for a long trade confirmed by price action.
The resistance overhead seems to be strong and active but a strong move up will logically stop or pause at around 103.84 and this is where I am looking for a short trade, but this would also require price action confirmation.
A candlestick analysis of the higher time frames reveals a mixed picture: bearish on the monthly, bullish on the weekly, but bearish on the daily. This means we should not be afraid to look for the start of a big move which is likely to be long, but we can also feel free to look for a good short trade too.
Last week saw a strong move up by all the major currencies against the JPY. This pair broke a bearish trend line that had been established since early January. Yesterday was expected to be a quiet day and in fact it was quiet, with the pair printing a somewhat bullish inside candle on the daily chart, with yesterday’s low just retesting the broken trend line from above before moving up modestly.
Although we have already had a bullish retest, I am still waiting for the price to fall down to the 102.83 level which is currently quite confluent with that trend line, and to look for an opportunity confirmed by price action there. As we have a confluent of a flipped resistance to support level and a broken trend line retest, this should be a high-probability trade.
Unfortunately there is plenty of local resistance not far overhead at around 103.40, which is the 23.6% Fibonacci retracement level of the previous major long-term upwards move. Above that we have a resistance level at 103.84 which is highly confluent with today’s R1 GMT daily pivot point, where I am now prepared to look for a short trade if confirmed by the price action when the level is next reached.
There are no important data releases scheduled today concerning the JPY or the USD.

