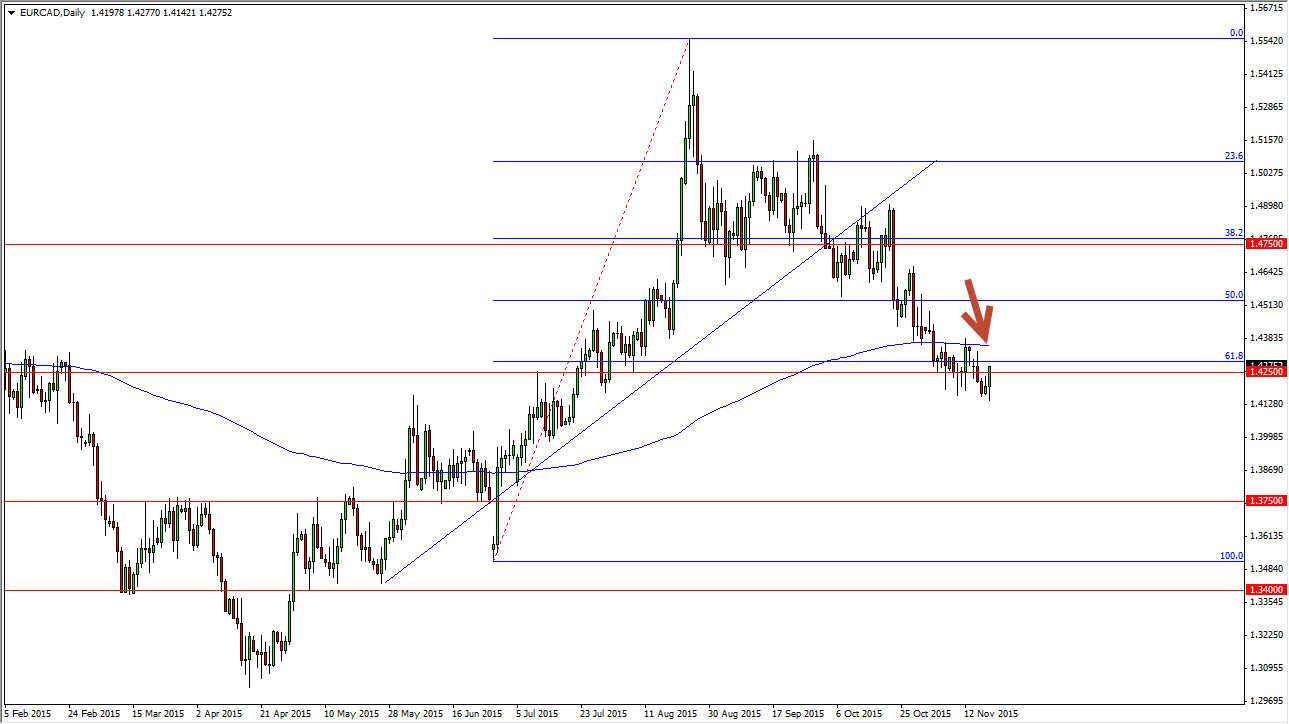
Lately, I’ve been paying quite a bit of attention to the EUR/CAD pair, which is very interesting to me because of the issues in the European Union as far as the economy is concerned, and of course what’s going on in the oil markets, as they are falling apart. Remember, the Canadian dollar is highly leveraged to the crude oil market, and when oil falls, the Canadian dollar typically does as well. However, this market has ignored the fact that oil has fallen, and as a result I think of it more or less as a barometer of what’s going on in the European Union. Typically, this pair should go higher as oil falls, but it has done the exact inverse. With that, I cannot help but notice that it tells us that the Euro is in quite a bit of trouble. It’s easy to see that on the EUR/USD pair chart, but we start seeing it in other currencies, even when they should be going higher, that shows you just how bad things are for the Euro.
200 day Exponential Moving Average
The exponential moving averages just above, and has provided a bit of resistance recently. With this, I’m looking for some type of resistive candle in order to start selling again, or perhaps a break down below the lows from the session on Thursday. If we break down below there, I feel that the market will reach towards the 1.3750 level, which was previous support. If we get below there, and I think we should, we will then reach down to the 100% Fibonacci Retracement level. That area typically gets aimed for after you break down below the 61.8% level.
At this point time, I don’t really have a scenario in which a willing to buy this pair. Either I will get the sell signal that I’m looking for, or I will simply sit on the sidelines and ignore this market.

