S&P 500
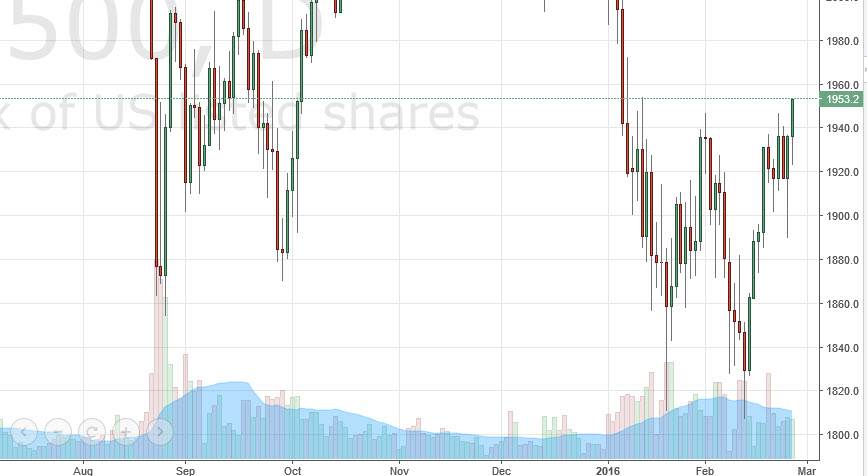
The S&P 500 initially fell on Thursday, but as you can see turned back around and form a rather bullish candle. Because of this, I feel that this market is going to continue to go higher, especially considering that we finally cleared the 1950 level that I’ve been paying so much attention to. With this, I think short-term pullbacks will offer value that you can take advantage of. Ultimately, this market should go to the 2000 level but it’s going to take some time to get there.
I don’t know if we get above the 2000 level, I look at this more or less as a technical bounce at this point, because there are quite a few moving headwinds out there that could derail any type of rally in the markets overall. In fact, some banks are now starting the claim that we are getting ready to see another global recession.
NASDAQ 100
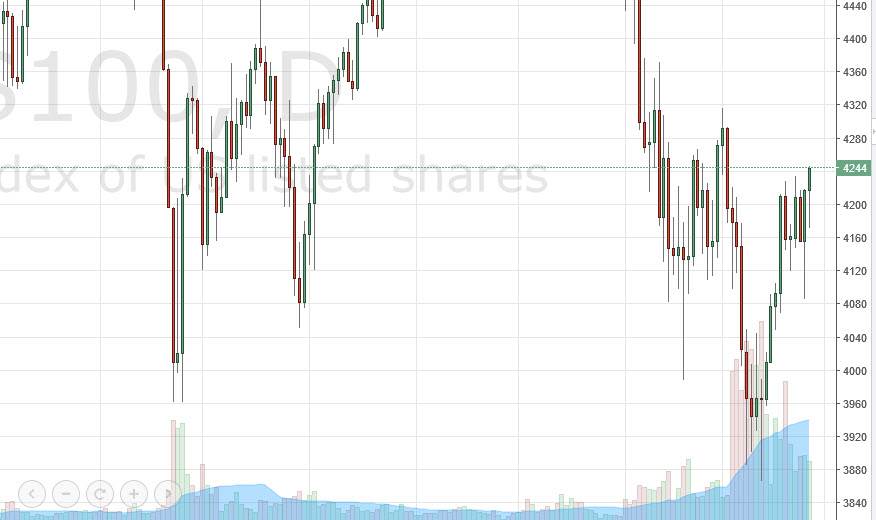
This chart looks exactly the same as the S&P 500, as we have broken above the 4200 level. I think now we go to the 4300 level next, then eventually the 4360 handle. This is a market that should continue to show support below, because after all we did form a nice-looking hammer during the day. Given enough time, this market could break out above the 4360 level, but that’s all I’m comfortable predicting at the moment. I think is going to be very choppy, and very difficult to get there.
Keep in mind that the NASDAQ is highly influenced by global markets as most US technological companies that are listed on the NASDAQ tend to be major exporters. With this, pay attention to what’s going on in Europe and Asia, and use that as a bit of a tertiary indicator for where the NASDAQ 100 should go. This is especially true in some of the tech laden countries such as Korea.


