WTI Crude Oil
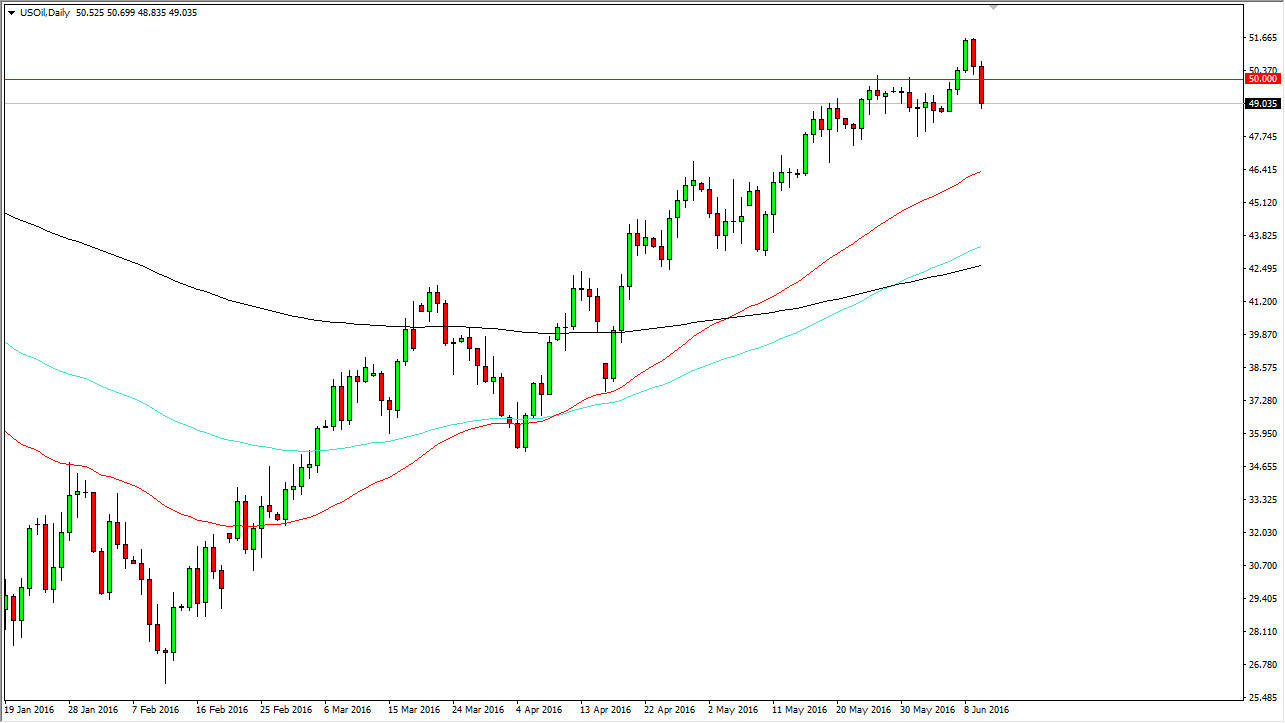
The WTI Crude Oil markets fell significantly during the course of the day on Friday, crashing well below the $50 level, and in fact even testing the $49 level. The weekly candle is a shooting star, and that of course is a very negative sign so will be interesting to see what happens next. As far as the daily chart is concerned, I do see a bit of support just below so I think that perhaps we will continue to go lower but could get a bit of a bounce back and then a continuation of the uptrend. The red line on the chart of course is the 50 day exponential moving average, and if we break down below there than I think the trend would change again. I think at this point in time it makes sense that we pullback though, because quite frankly it’s been so bullish and perhaps we need a rest. On the other hand, if we break out to a fresh, new high, that would be a very strong sign of buying pressure.
Natural Gas
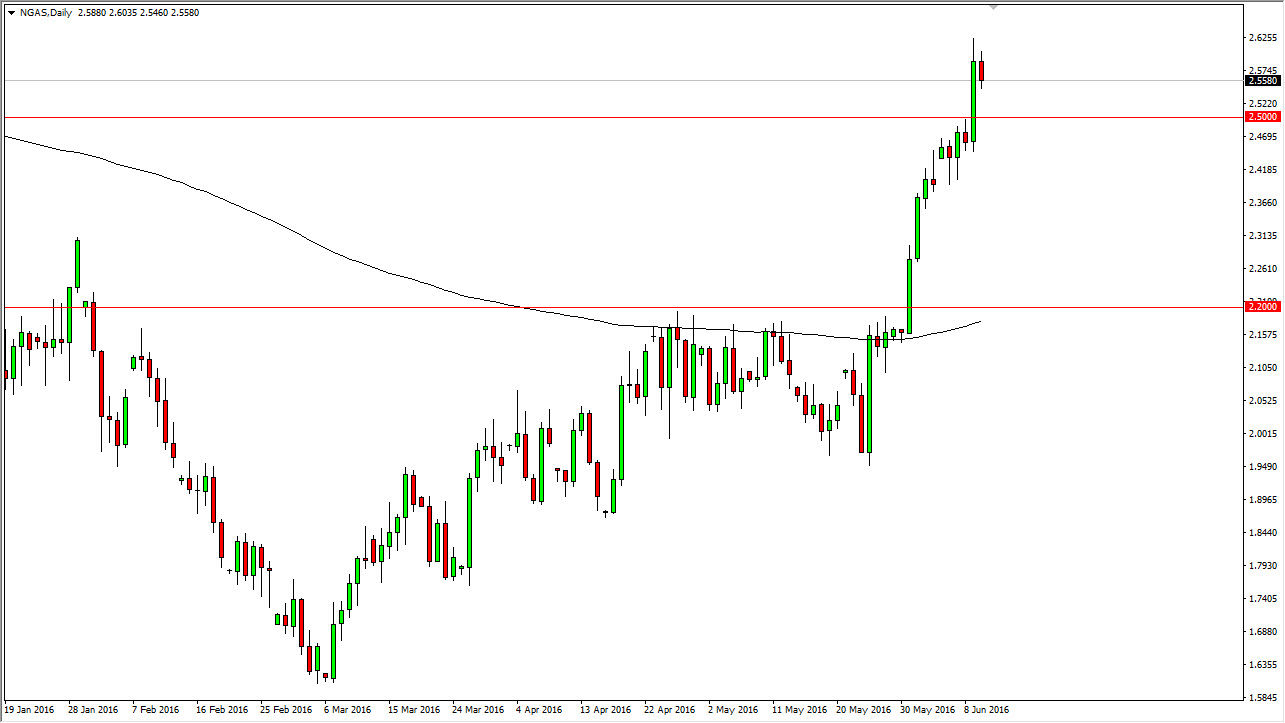
The natural gas markets fell a bit during the course of the day on Friday, but did get a little bit of support towards the end of the day. The hammer as you can see that formed for the day suggests that the buyers are coming back into the marketplace, and perhaps we are starting to pick up quite a bit of bullish pressure. The $2.50 level below should be supportive though, because it was so resistive previously. I think there is support below there and going all the way down to the $2.40 level. In other words, a pullback should be a buying opportunity on signs of support, just as a break above the high would be as well as the natural gas markets have seen so much strength.


