WTI Crude Oil
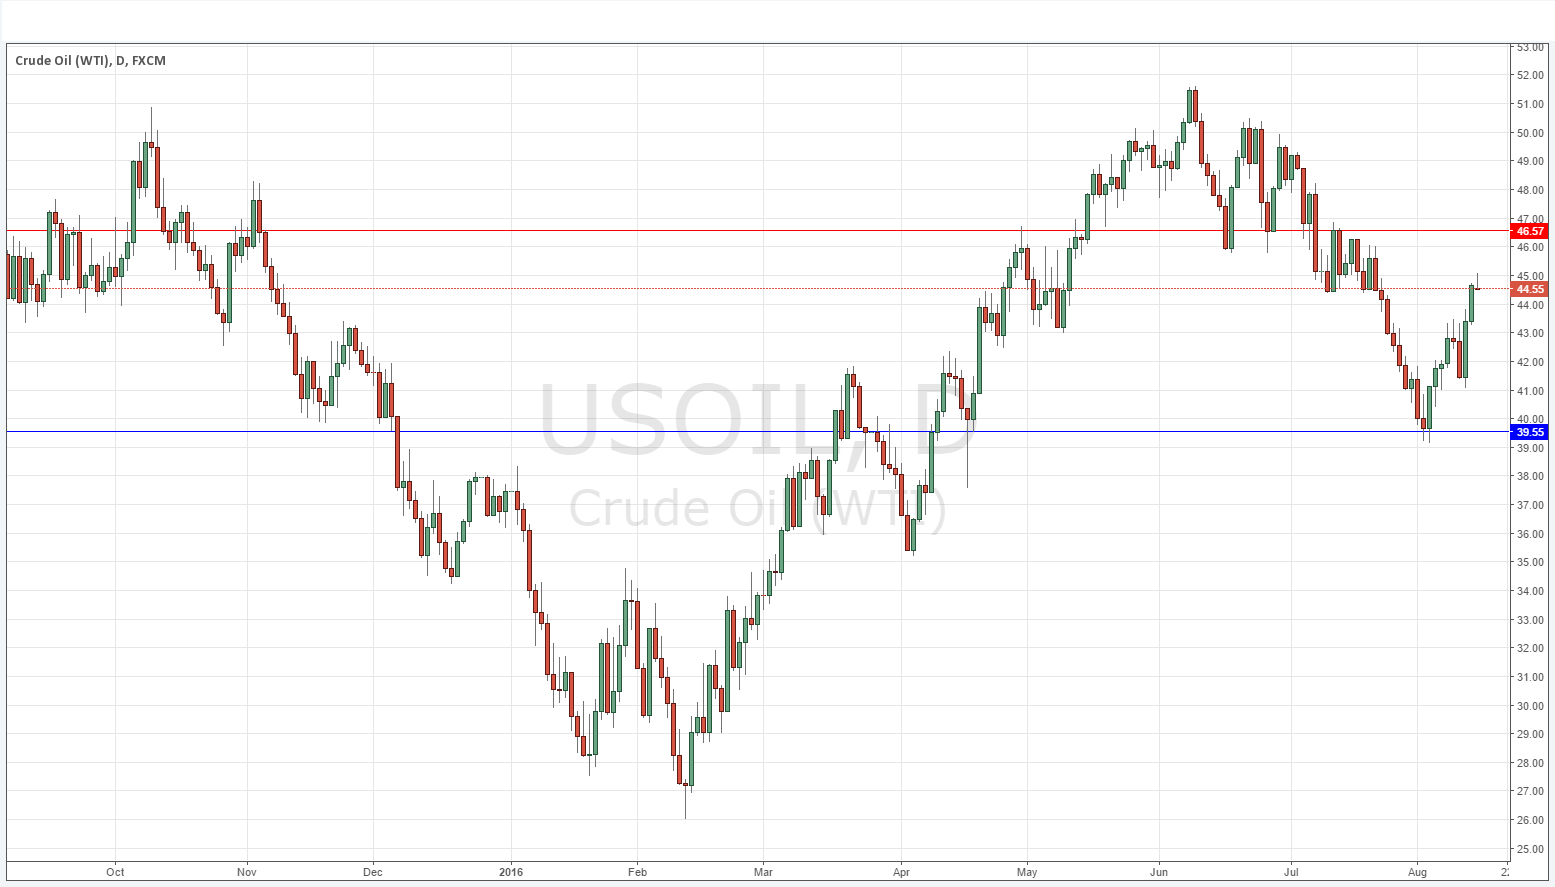
This is a very difficult instrument to call. Rather than making any clear long-term trends it tends to be making fairly wide runs up and down as short-term trends. Looking at the daily chart, you could say that the bulls are more impulsive, simply due to the relatively short length of the bearish retraces, but there has certainly been fairly strong and sloping selling which occurred above in the $52 to $45 range. In fact, these bearish candles are faster than the comparable upwards swing that happened earlier, so you could say the bears have the impulse. All in all, quite finely balanced.
Having said all that, we have been making an upwards move most recently from a supportive double bottom anchor at $39.55, but that move looks likely to have run into resistance right now. The clear cap would be at $46.57.
This is really not the most attractive market to be trading right now.
Natural Gas
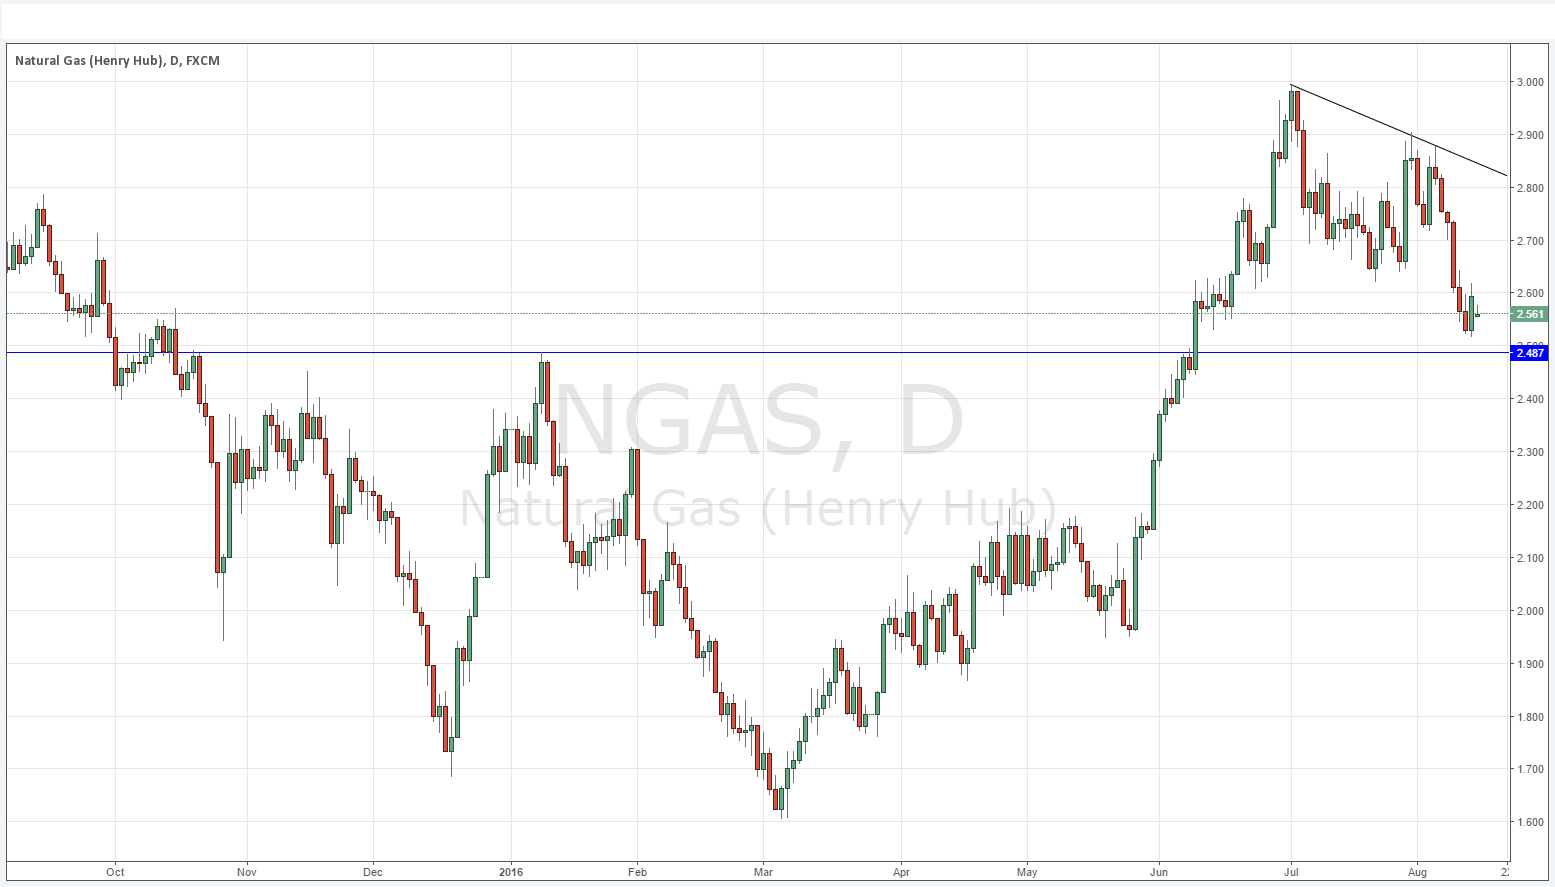
Again, it is tempting to say we are still in a long-term bullish pattern, as we have not retraced more than half of the strongly bullish wave which peaked just under $3. However, the selling was pretty fierce and the decline from the highs has been rapid, as well as forming a triple tap at a bearish trend line. Last week saw a strong sell-off.
I see the selling pressure should be able to continue to push the price down to the $2.50 area, at which it would be logical to be prepared for a bullish bounce. Alternatively, should be the price slice below this $2.48 level, I could see it falling rapidly to at least $2.20.


