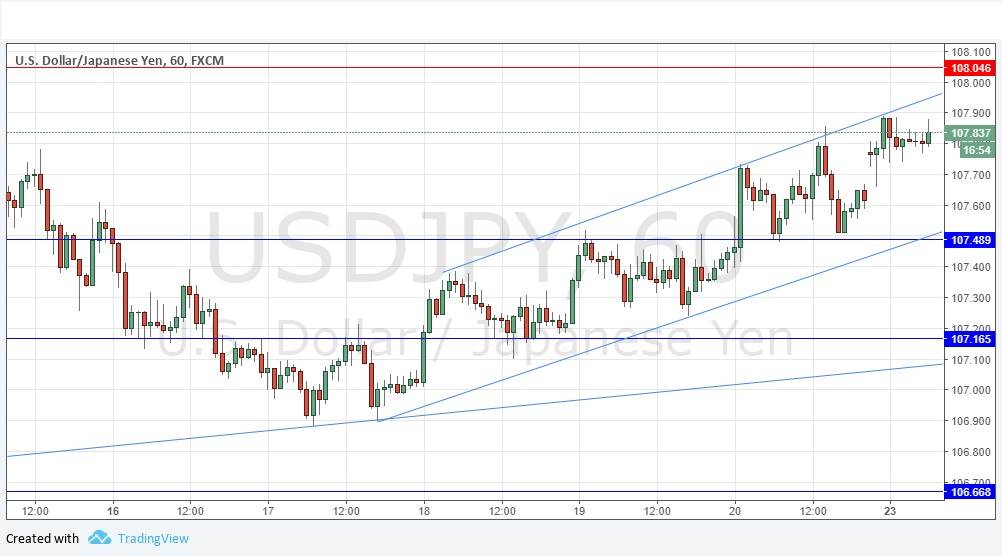
Last Wednesday’s signals produced an excellent long trade from the bullish outside candlestick which rejected the support level at 107.17.
Today’s USD/JPY Signals
Risk 0.75%.
Trades must be taken between 8am New York time and 5pm Tokyo time, over the next 24-hour period only.
Short Trade
Go short following a bearish price action reversal on the H1 time frame immediately upon the next touch of 108.05.
Put the stop loss 1 pip above the local swing high.
Adjust the stop loss to break even once the trade is 20 pips in profit.
Take off 50% of the position as profit when the trade is 20 pips in profit and leave the remainder of the position to ride.
Long Trades
Go long following a bullish price action reversal on the H1 time frame immediately upon the next touch of 107.50 or 107.17.
Put the stop loss 1 pip below the local swing low.
Adjust the stop loss to break even once the trade is 20 pips in profit.
Take off 50% of the position as profit when the trade is 20 pips in profit and leave the remainder of the position to ride.
The best method to identify a classic “price action reversal” is for an hourly candle to close, such as a pin bar, a doji, an outside or even just an engulfing candle with a higher close. You can exploit these levels or zones by watching the price action that occurs at the given levels.
USD/JPY Analysis
I wrote last Wednesday that the price action seemed to be unpredictable and that it might be best to avoid trading this pair. However, the key support at 107.17 held and the price has been advancing slowly but surely ever since, forming a perfectly symmetrical short-term bullish price channel which is shown in the chart below. The support at 107.50 looks particularly strong, as a confluence of the lower channel trend line, horizontal level, and psychological number. Despite the fact a long-term bearish trend is still technically in force, the price seems very firm, so I have a bullish bias on this pair.
There is nothing due today concerning either the JPY or the USD.
