The difference between success and failure in Forex trading is very likely to depend upon which currency pairs you choose to trade each week, and not on the exact trading methods you might use to determine trade entries and exits. Each week I am going to analyze fundamentals, sentiment and technical positions in order to determine which currency pairs are most likely to produce the easiest and most profitable trading opportunities over the next week. In some cases it will be trading the trend. In other cases it will be trading support and resistance levels during more ranging markets.
Big Picture 6th May 2018
In my previous piece last week, I forecasted that the best trades would be short GBP/USD and long USD/SEK. GBP/USD fell strongly, by 1.81%, while USD/SEK rose by 1.64%, giving a large average win of 1.73%.
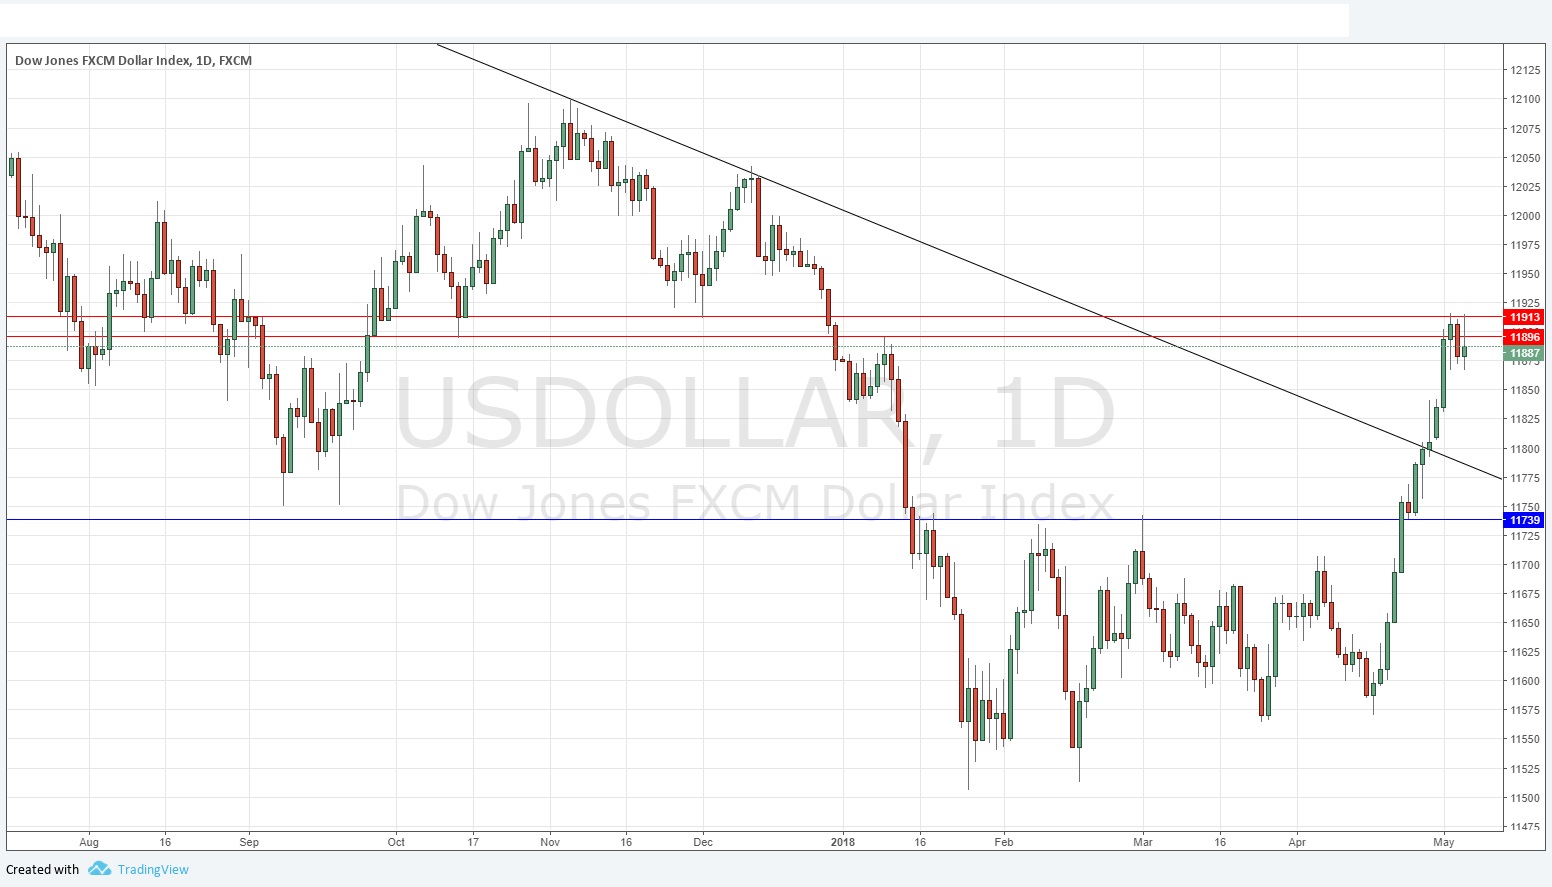
Last week saw a continuing strength in the U.S. Dollar, while almost every other currency except the Japanese Yen fell in their relatively values against the greenback. The U.S. Dollar Index made another new 4-month high price, while the U.S. stock market (represented by the S&P 500 Index) is showing a little life but remains trapped between a bearish trend line and the 200-day moving average. Crude Oil has continued to rise to new long-term high prices, making another new 3-year high. The British Pound and to a lesser extent the Euro are looking weak.
The major economic data releases last week were U.S. Non-Farm Payrolls and Average Hourly Earnings data which came in weaker than expected. However, the weakness did not halt the continuing strength in the U.S. Dollar, which is a bullish sign for that currency. The major political driver this week is tension over what will happen regarding the Iran deal as U.S. sanctions policy against Iran comes up for renewal on 12th May.
Fundamental Analysis & Market Sentiment
Fundamental analysis tends to support the U.S. Dollar; and this seems to be increasingly supported by sentiment. The 10-year yield remains close to 3% but GDP looks strong. Sentiment has turned sour on the British Pound as GDP data shows its economy is barely growing.
Technical Analysis
U.S. Dollar Index
The daily price chart below shows a strong bullish move was made over the week, with the Index making a new 4-month high price and closing between its price levels from 3 months and 6 months ago, invalidating the long-term bearish trend. This is a continuation of a major bullish technical change. The long-term bearish trend line has been decisively broken, but the price has now reached a zone of resistance which may contain it for a while at least.
GBP/USD
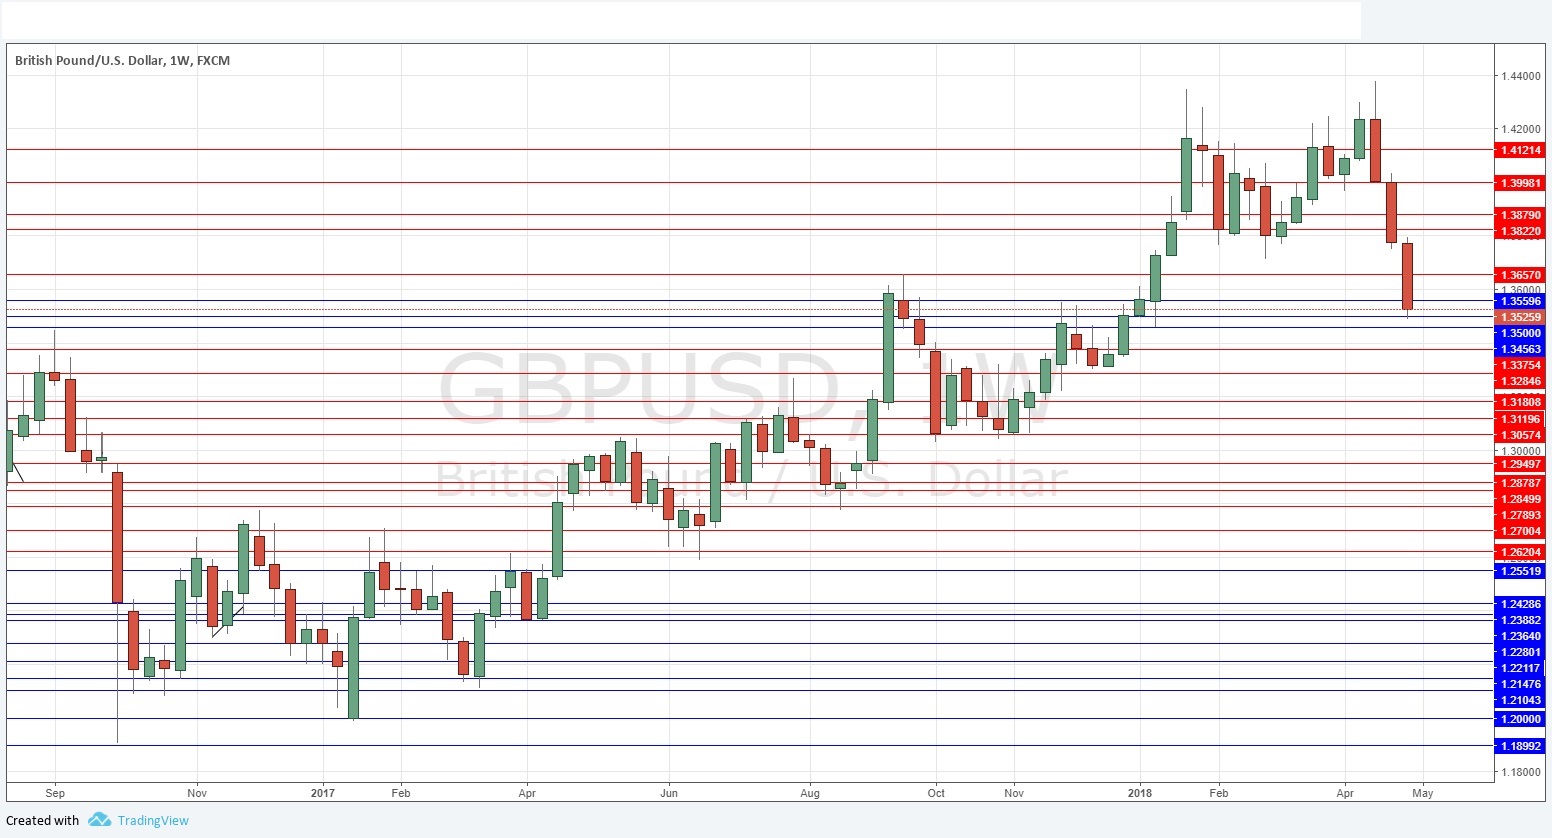
This pair had been in a long-term bullish trend for a long time, but has fallen strongly for a third consecutive week, closing very near its low, and now shows a strongly a bearish 3-month trend. The bearish momentum here, coupled with U.S. Dollar strength and poor British GDP figures which are creating a very negative sentiment on the the Pound, make it likely that this pair will fall further over the coming week, although probably not as strongly as it did last week.
EUR/USD
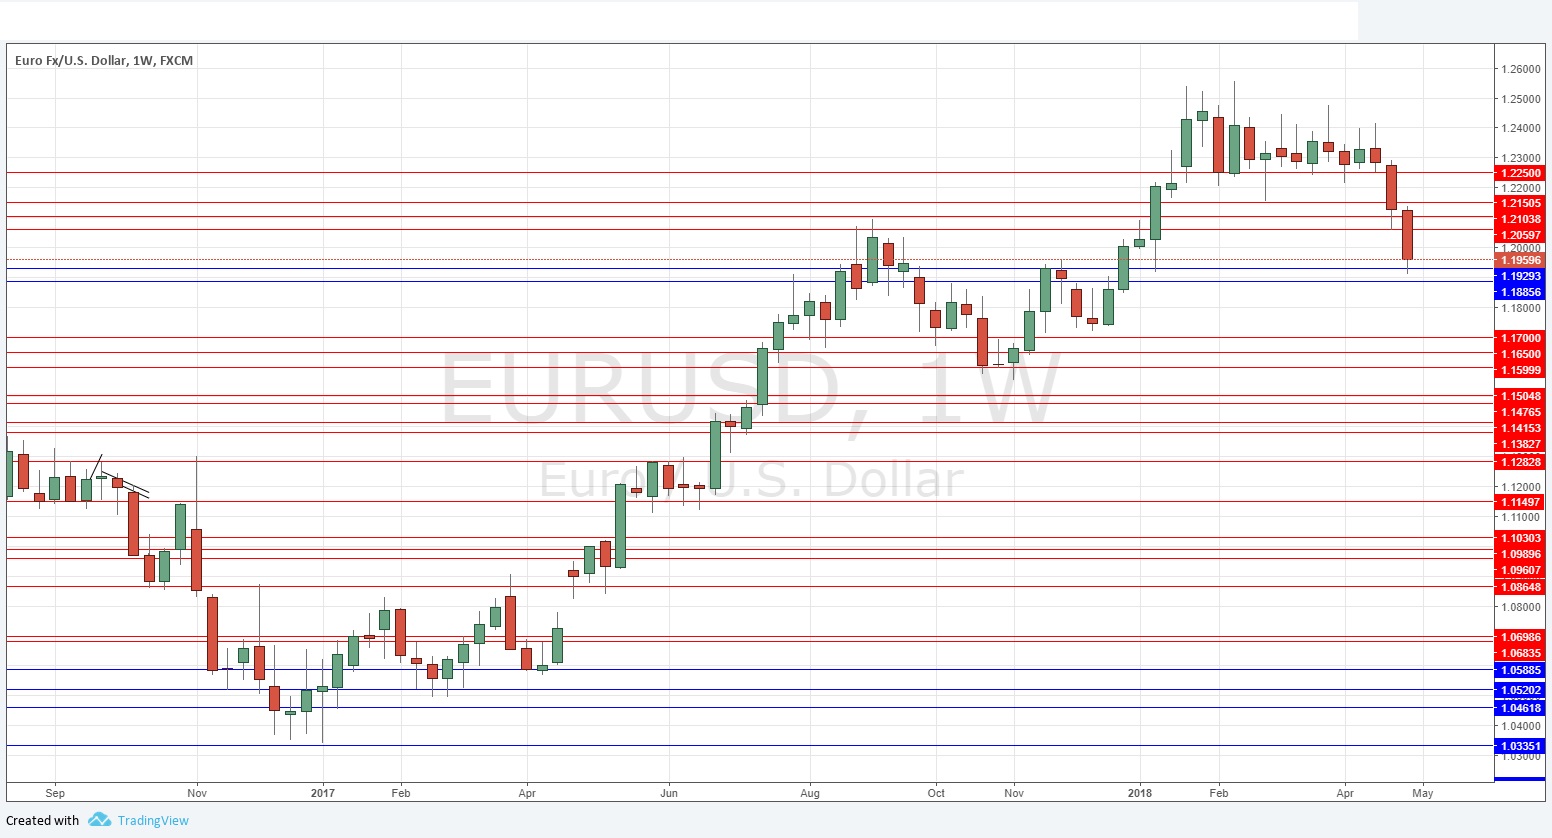
There is more or less the same situation here as there is with GBP/USD, except the Euro is dragged down to some extent by the British Pound. It is less fundamentally weak than the Pound, but should not be ignored as it is falling strongly against the USD after breaking down strongly from a multi-month consolidation zone.
WTI Crude Oil
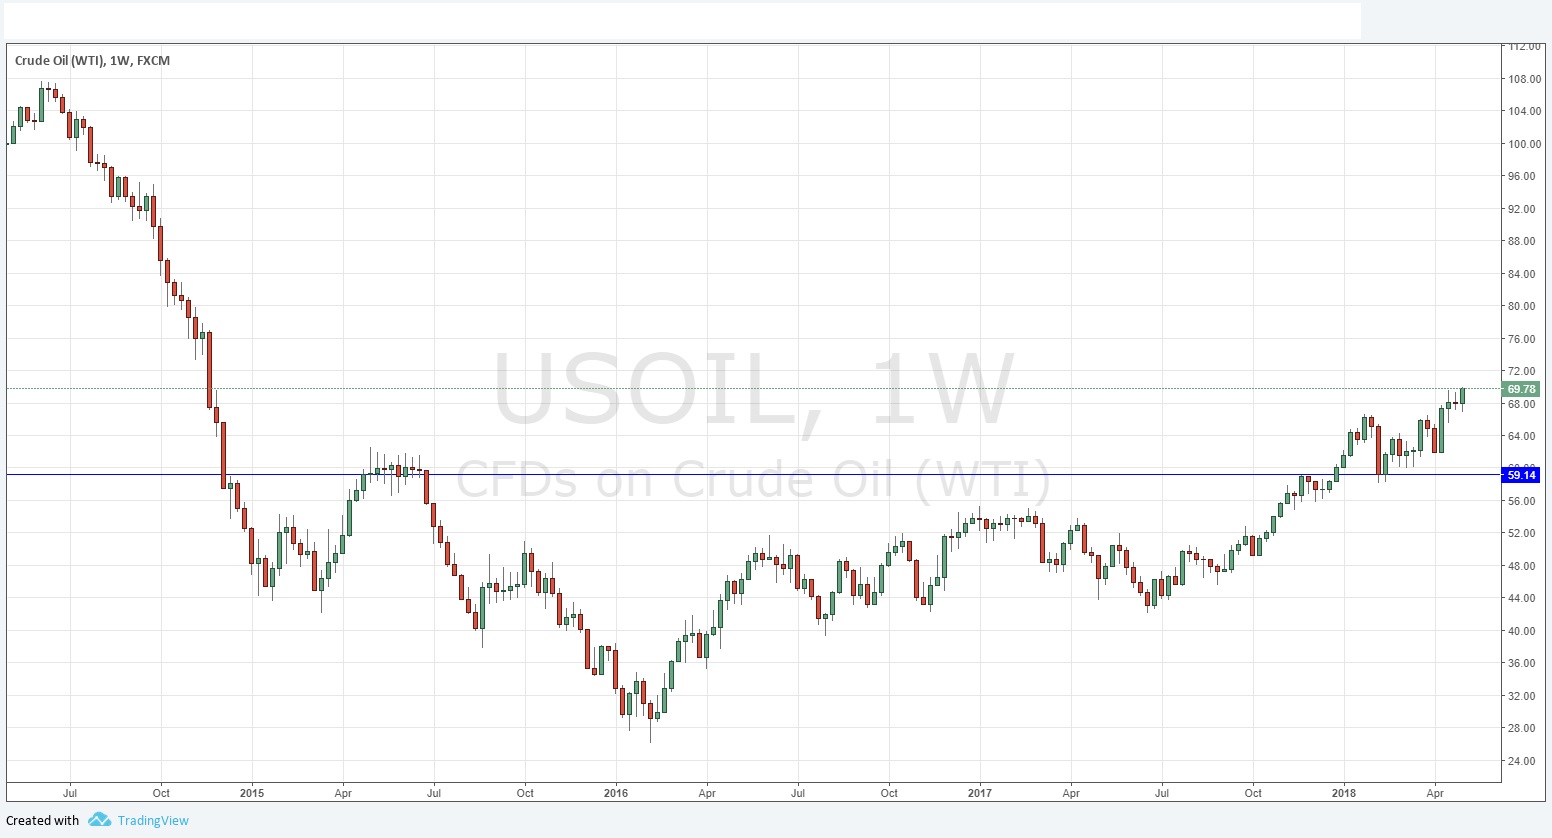
The weekly chart below shows the price made a new 3-year high and closed right on its high price. There is a strong, long-term bullish trend here, and with tensions in the Middle East remaining high, the price may rise quite a lot further very quickly.
Conclusion
Bearish on GBP/USD and EUR/USD; bullish on WTI Crude Oil.


