The difference between success and failure in Forex trading is very likely to depend upon which currency pairs you choose to trade each week, and not on the exact trading methods you might use to determine trade entries and exits. Each week I am going to analyze fundamentals, sentiment and technical positions in order to determine which currency pairs are most likely to produce the easiest and most profitable trading opportunities over the next week. In some cases it will be trading the trend. In other cases it will be trading support and resistance levels during more ranging markets.
Big Picture 24th June 2018
In my previous piece last week, I forecasted that the best trades would be long USD/MXN and long USD/ZAR above the previous week’s highs. USD/MXN never broke the previous week’s high. USD/ZAR did but made a small loss, closing down from the previous week’s high price by 0.50%. I also forecasted that long USD/CAD and short AUD/USD would be good trades. USD/CAD ended the week up by 0.58% while AUD/USD ended the week unchanged. This means that overall it was a neutral week for these forecasts, giving a tiny win of only 0.02%.
Last week saw a fall in the relative value of the U.S. Dollar and the commodity currencies, while safe haven assets such as the Japanese Yen and Swiss Franc gained. The Euro also rose.
The major event of last week was the policy input from the Bank of England, which had the effect of boosting the British Pound and the Euro toward the end of the week.
Fundamental Analysis & Market Sentiment
Fundamental analysis tends to support the U.S. Dollar, as American economic fundamentals continue to look strong. The weakest and most vulnerable currency is the Canadian Dollar, which is suffering not only due to U.S. tariffs but also due to poor Canadian economic data releases.
Emerging market currencies such as the Mexican Peso and South African Rand, which had been very weak, recovered quite sharply last week.
The week ahead will probably be dominated by the release of U.S. Final GDP data, although there is also monthly input from the Reserve Bank of New Zealand which could impact the Kiwi significantly.
Technical Analysis
U.S. Dollar Index
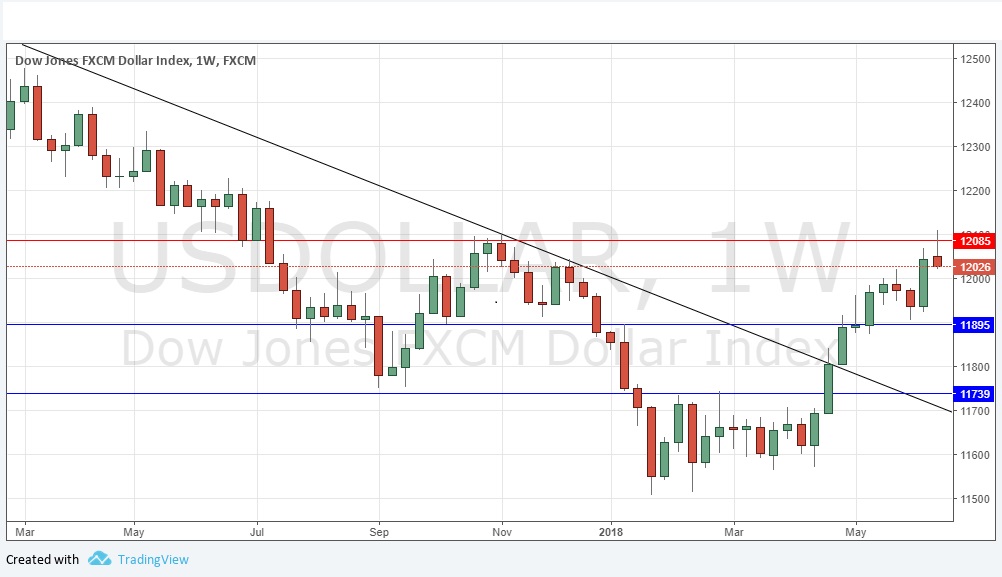
The weekly price chart below shows a somewhat weak bearish pin candlestick move was made over the week, with the Index rejecting the resistance level at 12085 as shown in the price chart below. However, it is remaining above its price level from both 3 months ago and 6 months ago, sitting in a long-term bullish trend. This produces a situation suggesting the price may be bearish over the short-term, which still in a bullish trend that can be expected to reassert itself.
USD/CAD
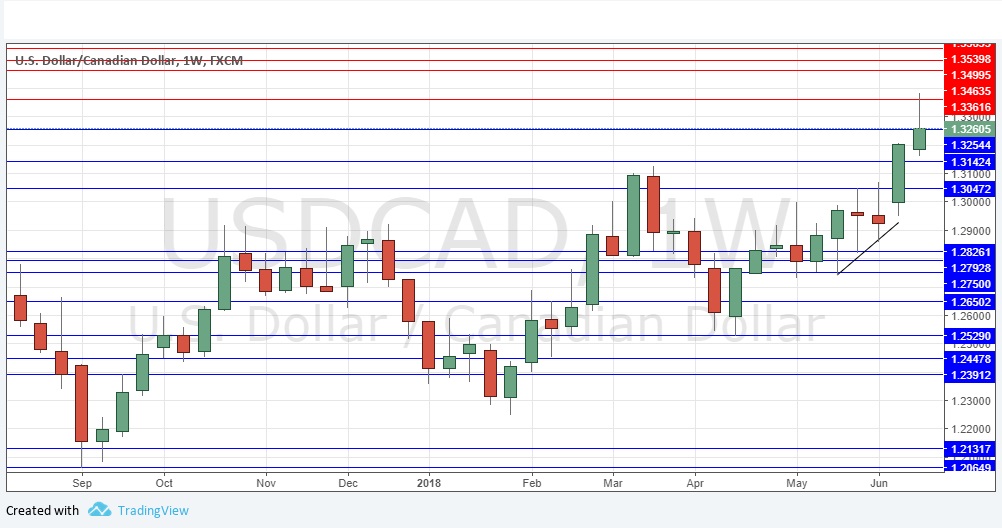
This pair spent two weeks trying to break above the resistance level at 1.3050 and it finally managed to do so two weeks ago. When the break came it was very strong and fast, and it was at the heart of the movement in the Forex market. I said last week it would be surprising if the price did not rise further here, and it did. However, the price sold off quite strongly on Friday, and as the chart shows, the week ended with a large upper wick. Higher prices are still quite possible next week, even likely, but caution needs to be taken to see strong bullish momentum before entering long.
USD/MXN
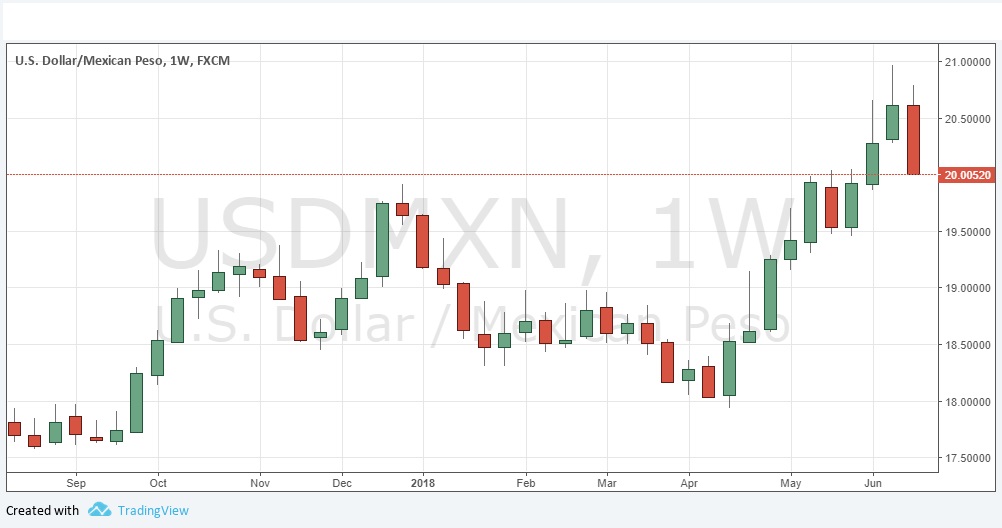
This pair was very bullish last week but fell heavily and closed right on its low. There is a long-term bullish trend, and the price fell by a little more than 3% over the week, while remaining above its price levels of both 3 months and 6 months ago. Although there is no sign yet of the bearish momentum ending, such strong movements against the long-term trend typically reverse the next week, so a profitable long trade might present itself if the momentum reverses convincingly on shorter time frames.
Conclusion
Bullish on the USD, bearish on the CAD.


