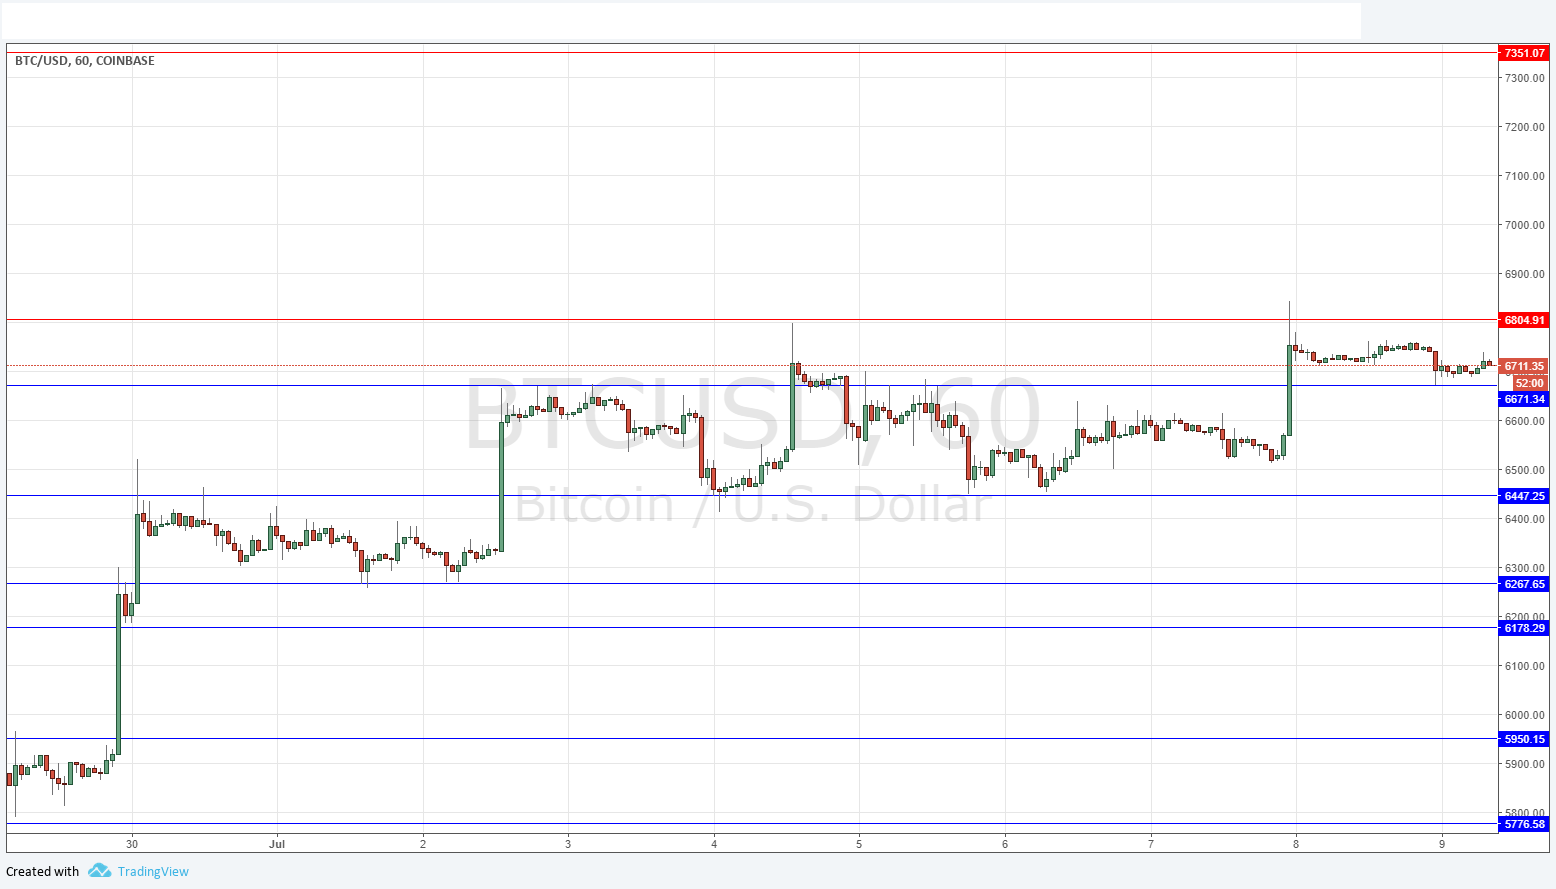
Last Thursday’s signals produced a losing long trade from the bullish pin candlestick which rejected the support level identified at $6,546.
Today’s BTC/USD Signals
Risk 0.75% per trade.
Trades may only be taken between 8am and 5pm Tokyo time, during the next 24-hour period.
Long Trades
Long entry after a bullish price action reversal on the H1 time frame following the next touch of $6,671, $6,447, or $6,268.
Put the stop loss 1 pip below the local swing low.
Move the stop loss to break even once the trade is $200 in profit by price.
Remove 50% of the position as profit when the trade is $200 in profit by price and leave the remainder of the position to run.
Short Trade
Short entry after a bearish price action reversal on the H1 time frame following the next touch of $6,805.
Put the stop loss 1 pip above the local swing high.
Move the stop loss to break even once the trade is $200 in profit by price.
Remove 50% of the position as profit when the trade is $200 in profit by price and leave the remainder of the position to run.
The best method to identify a classic “price action reversal” is for an hourly candle to close, such as a pin bar, a doji, an outside or even just an engulfing candle with a higher close. You can exploit these levels or zones by watching the price action that occurs at the given levels.
BTC/USD Analysis
I wrote last Thursday that it felt as if a break below $6,500 could produce a sharper move downwards as long trade stops would be uncovered. I was not correct, although the price did not get far below this level. We have an essentially bullish picture of rising stairsteps with higher and higher support. If the price can break above the resistance at $6,850 then it has room to rise all the way to the psychological level of $7,500 without encountering any obvious obstructions. I have a bullish bias today provided the price remains above $6,671.
There is nothing important due today regarding the USD.

