The difference between success and failure in Forex trading is very likely to depend upon which currency pairs you choose to trade each week, and not on the exact trading methods you might use to determine trade entries and exits. Each week I am going to analyze fundamentals, sentiment and technical positions in order to determine which currency pairs are most likely to produce the easiest and most profitable trading opportunities over the next week. In some cases it will be trading the trend. In other cases it will be trading support and resistance levels during more ranging markets.
Big Picture 23rd December 2018
In my previous piece two weeks ago, I again forecasted that the best trade would be long Gold against the U.S. Dollar. Since then the price has risen as forecast, giving a win of 0.61%.
Last week saw a rise in the relative value of the Japanese Yen, and a strong fall in the relative values of the Australian and Canadian Dollars.
Last week’s Forex market was quite noisy and was dominated by a strong sell-off in the U.S. stock market, which is flirting with bear market territory (the NASDAQ technology index is already officially in a bear market) according to the typical benchmark of a fall of at least 20% from the high. This environment has caused safe havens such as Gold and the Japanese Yen to strengthen, while riskier assets such as commodity currencies have fallen, as have commodities such as Crude Oil.
This week is likely to be dominated by what happens to the U.S. stock market, which seems set to fall further, and this would suggest that the currencies which performed strongly or weakly last week are likely to do so again this week.
Fundamental Analysis & Market Sentiment
Fundamental analysis still tends to support the U.S. Dollar, as does last week’s rate hike, although there is a stronger feeling that growth is slowing down, and as the stock market heads towards a bear market, sentiment is likely to weaken. It now seems that the path of hikes in the near term will be halted after last week’s quarter-point rate hike, which shows increasing relative fragility in the U.S. economy. Increasingly, analysts are saying that there should be no further hikes in 2019, while the FOMC plans another two. Sentiment seems to be still in favor of the U.S. Dollar, but it is weakening. Safe havens are attracting inflow in this near-bear market environment.
Brexit remains an unknown, and the situation is unlikely to be clarified until Parliament starts to prepare for a new vote on a possible deal by approximately 14th January.
Technical Analysis
U.S. Dollar Index
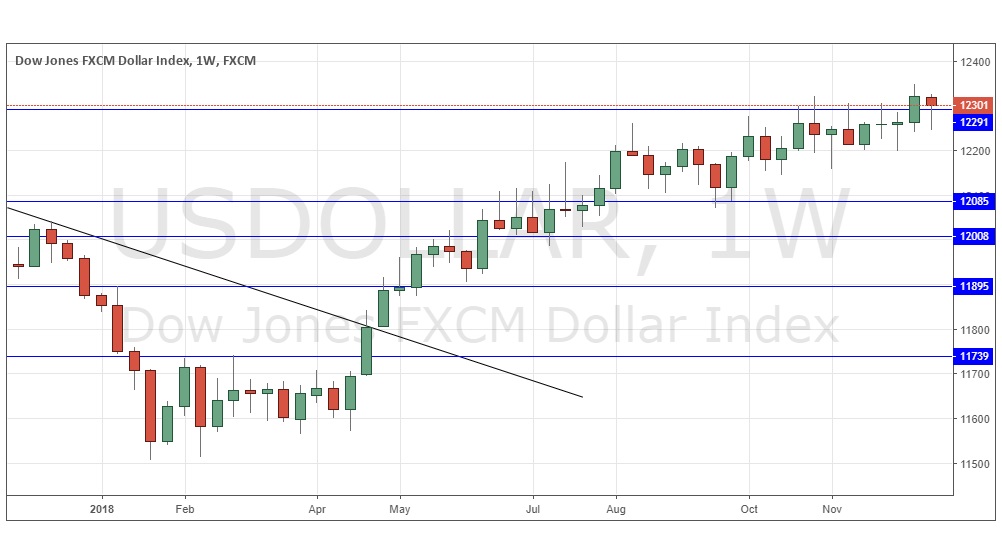
The weekly price chart below shows that last week the USD Index reached its highest price since April 2017, advancing with a reasonably strong bullish candlestick above the former resistance level of 12291 which has held for the past several weeks. This was a bullish development. This week has produced a semi-bullish near-pin candlestick, which has closed near its high and has also closed above the former resistance, which may now have become new support. I do not have very strong confidence as to short-term direction, although the edge is still technically in line with the long-term bullish trend, which remains intact. It is now looking more likely that the bullish trend will continue.
S&P 500 Index
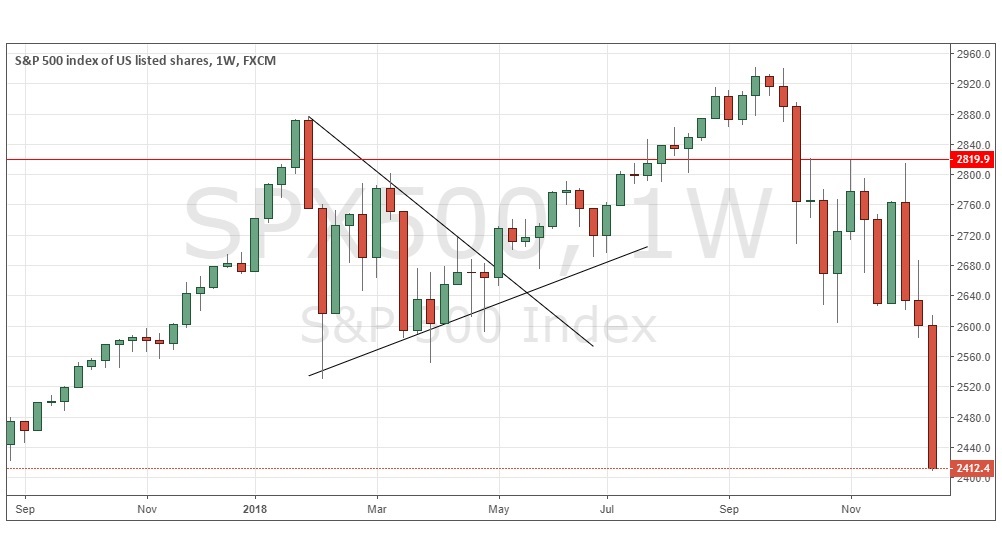
The weekly chart below shows last week produced the biggest fall in the world’s major stock index in the last ten years. The price closed right on the low of this huge candlestick, which is very bearish. The price is below its level of 6 months ago and we have already seen the 50-day moving average cross below the 200-day moving average “the “bear cross”). These are all bearish signs and the chances look good that this Index will fall further over the course of next week, especially as year-end tends to bring stock sales.
USD/CAD
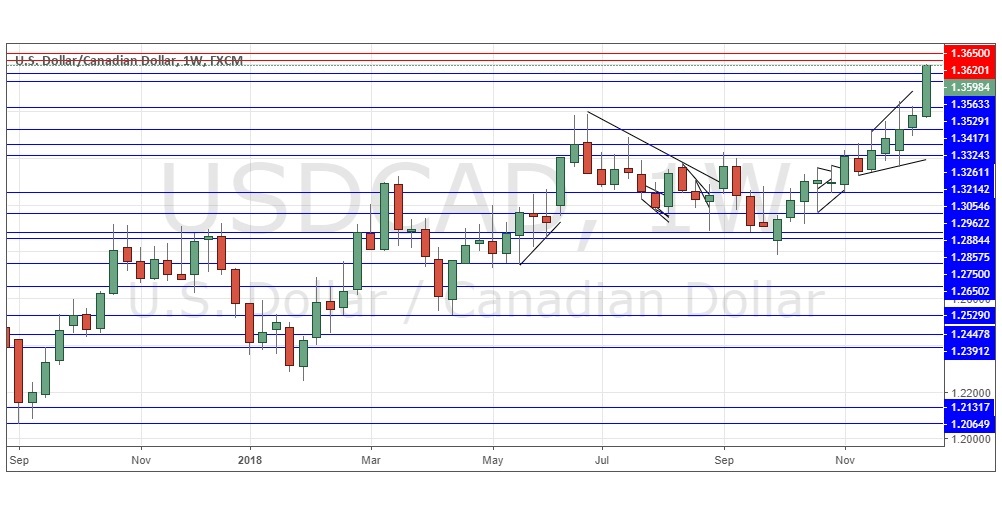
The weekly chart below shows last week produced a very strongly bullish candlestick, of a large range and closing right on its high. These are the highest prices seen in this Forex currency pair for more than 18 months. The price chart below shows how long-term and consistent the trend has been over most of this period, and the trend has accelerated as the price of Crude Oil has dropped sharply and beaten down the Canadian Dollar. All the signs are bullish, and the probability is that we will see still higher prices over the coming week.
GOLD
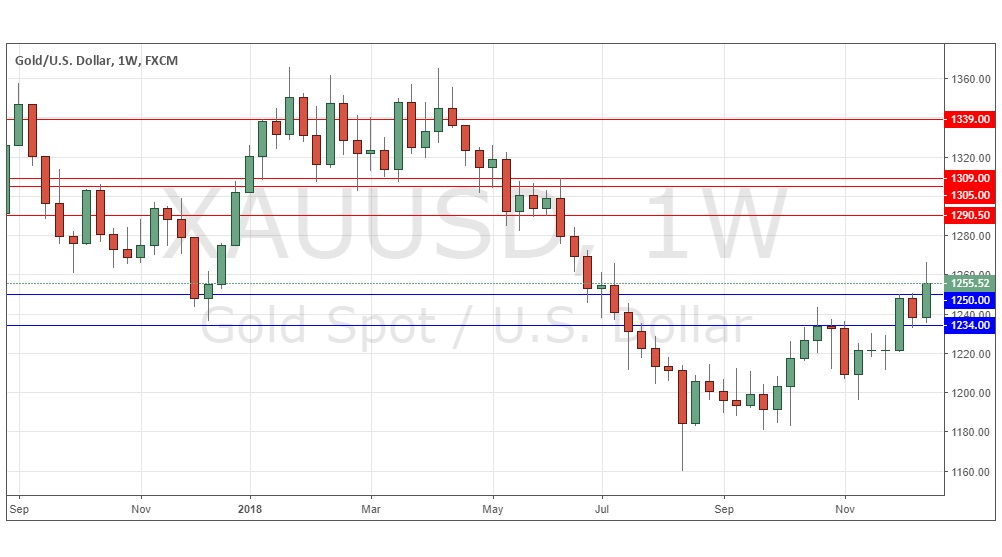
The weekly chart below shows last week produced a large and reasonably strong bullish candlestick. The price closed above the psychologically important $1250 level and made the highest close and highest high seen in over six months. These are significant bullish signs, but the price retreated from its highs to form a significant upper wick on the weekly candlestick, which suggests a note of caution within an otherwise bullish picture. Sentiments in markets are nervous, which tends to help safe havens such as Gold, but any rise will probably be less clean than the falls we are seeing in stocks and Crude Oil / Canadian Dollar.
Conclusion
Bearish on the Canadian Dollar and the S&P 500 Index, cautiously bullish on Gold and the U.S. Dollar.


