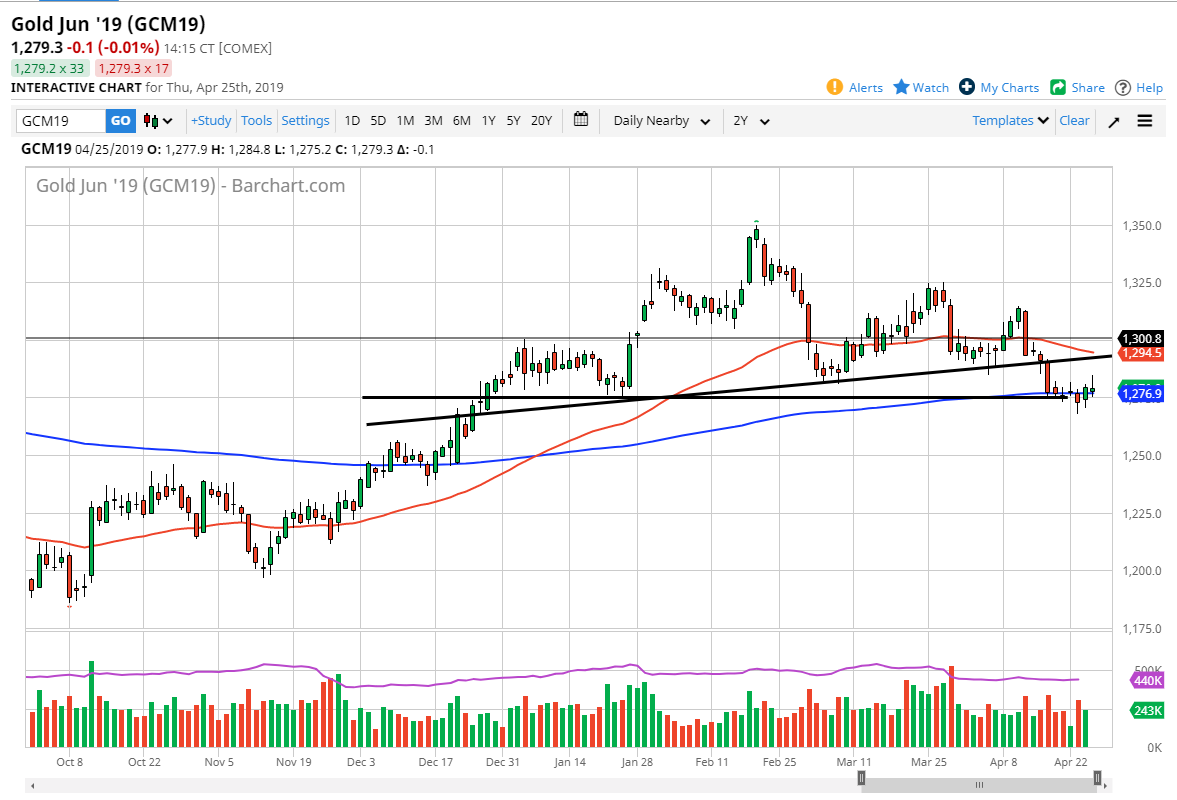
Gold markets initially tried to rally during the trading session on Thursday but gave back the gains to turn around and form a bit of a shooting star. This is interesting, because the area that we are currently trading around features the 200 day EMA, and that of course is something that will attract a lot of interest. At this point, I suggested previously that the previous uptrend line that forms the neckline of the head and shoulders pattern is going to be massive resistance. We even get that far before selling off, and therefore it shows just how much interest there is in shorting Gold.
At this point, I think we’re going to bounce around in this general vicinity with a short-term trading type of attitude, shown by the shooting star from the session on Thursday, and the hammer on Tuesday. The $1275 level will attract a lot of attention as well, as it is an area that was previous support and resistance.
I do break down below the Tuesday candle, the market could go much lower, perhaps reaching towards $1250 level, and then the $1225 level. The head and shoulders that was broken previously does suggest that perhaps we would go to the $1225 level to fulfill the measurement of the pattern. At this point, it’s not until we break above the previous neck line that I think we can buy this market. This is a massive barrier, so if we were to break above that it would be a very strong sign. The $1300 level will also offer resistance, just as the 50 day EMA, pictured in red will be. All in all, I believe that we are range bound with a negative attitude still.

