Start Trading Now Get Started
Table of Contents
Affiliate Disclosure
Affiliate Disclosure DailyForex.com adheres to strict guidelines to preserve editorial integrity to help you make decisions with confidence. Some of the reviews and content we feature on this site are supported by affiliate partnerships from which this website may receive money. This may impact how, where and which companies / services we review and write about. Our team of experts work to continually re-evaluate the reviews and information we provide on all the top Forex / CFD brokerages featured here. Our research focuses heavily on the broker’s custody of client deposits and the breadth of its client offering. Safety is evaluated by quality and length of the broker's track record, plus the scope of regulatory standing. Major factors in determining the quality of a broker’s offer include the cost of trading, the range of instruments available to trade, and general ease of use regarding execution and market information.

Gold Markets Plunge But Stay in Range - 2 May 2019

By Christopher Lewis
Christopher Lewis has been trading Forex and has over 20 years experience in financial markets. Chris has been a regular contributor to Daily Forex since the early days of the site. He writes about Forex for several online publications, including FX Empire, Investing.com, and his own site, aptly named The Trader Guy. Chris favours technical analysis methods to identify his trades and likes to trade equity indices and commodities as well as Forex. He favours a longer-term trading style, and his trades often last for days or weeks.

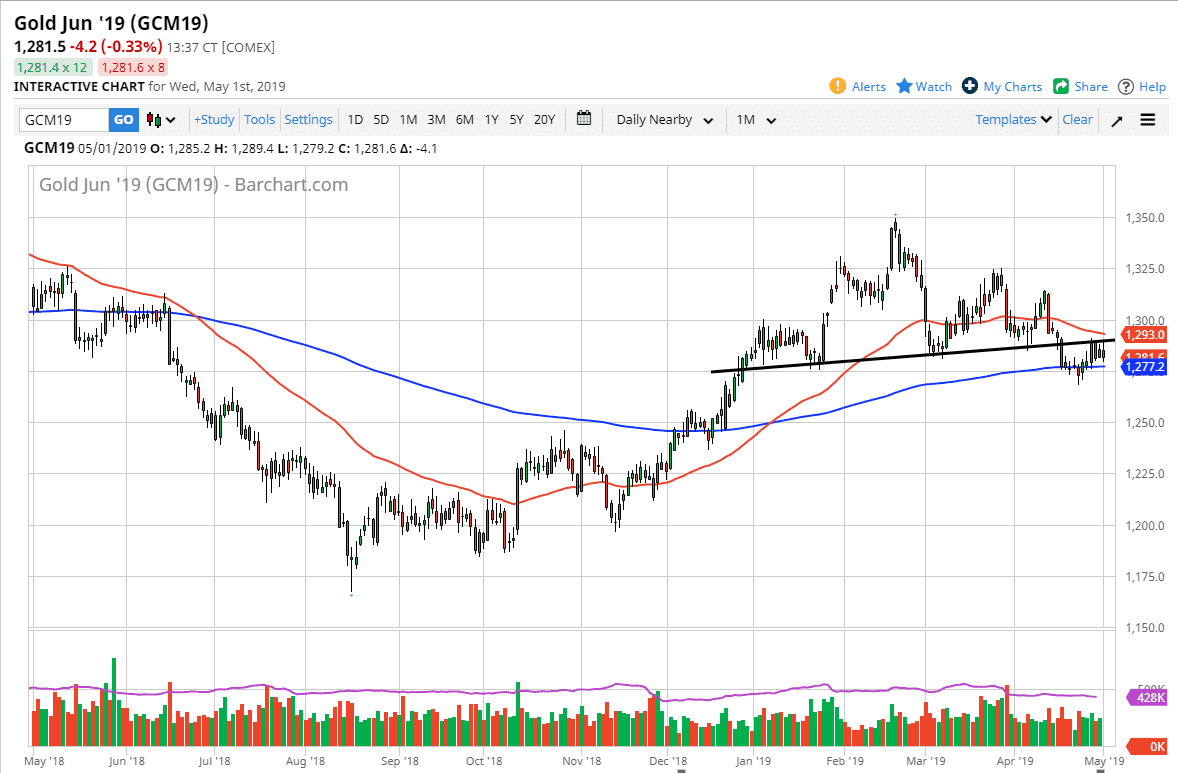
Gold markets fell during the trading session on Wednesday, reaching down towards the 200 day EMA after initially trying to rally and test the neck line of the head and shoulders pattern that I have marked on the chart. We are currently testing an area that will obviously attract a lot of attention as the 200 day EMA is a longer-term signal of sorts. Trim traders of course following, but at this point it still looks as if the market is going to struggle a bit to continue to go higher.

If we break down to a fresh, new low, then it’s possible that we could start to see Gold markets take off to the downside. Based upon the head and shoulders, it could measure for a move towards the $1225 level. That is an area that has a significant amount of volume in interest at it. It doesn’t mean that we will get there overnight, but it certainly looks like we could grind down towards that level.

To the upside, if we were to break above the neckline from the head and shoulders, we could then clear the 50 day EMA which is pictured in red. That opens the door to a potential move to the $1300 level, and possibly even the $1310 level after that. Although possible, I don’t like this trade as much because I see far too many technical issues above. Longer-term though, the buyers do take over we will probably reach towards the $1325 level and then eventually the $1350 level after that. All things being equal, this is a market that stays range bound but I think is starting to get a bit heavy. All we need at this point is perhaps a stronger US dollar to send it over the edge.

Gold

Christopher Lewis
About Christopher Lewis
Christopher Lewis has been trading Forex and has over 20 years experience in financial markets. Chris has been a regular contributor to Daily Forex since the early days of the site. He writes about Forex for several online publications, including FX Empire, Investing.com, and his own site, aptly named The Trader Guy. Chris favours technical analysis methods to identify his trades and likes to trade equity indices and commodities as well as Forex. He favours a longer-term trading style, and his trades often last for days or weeks.
 

Most Visited Forex Broker Reviews