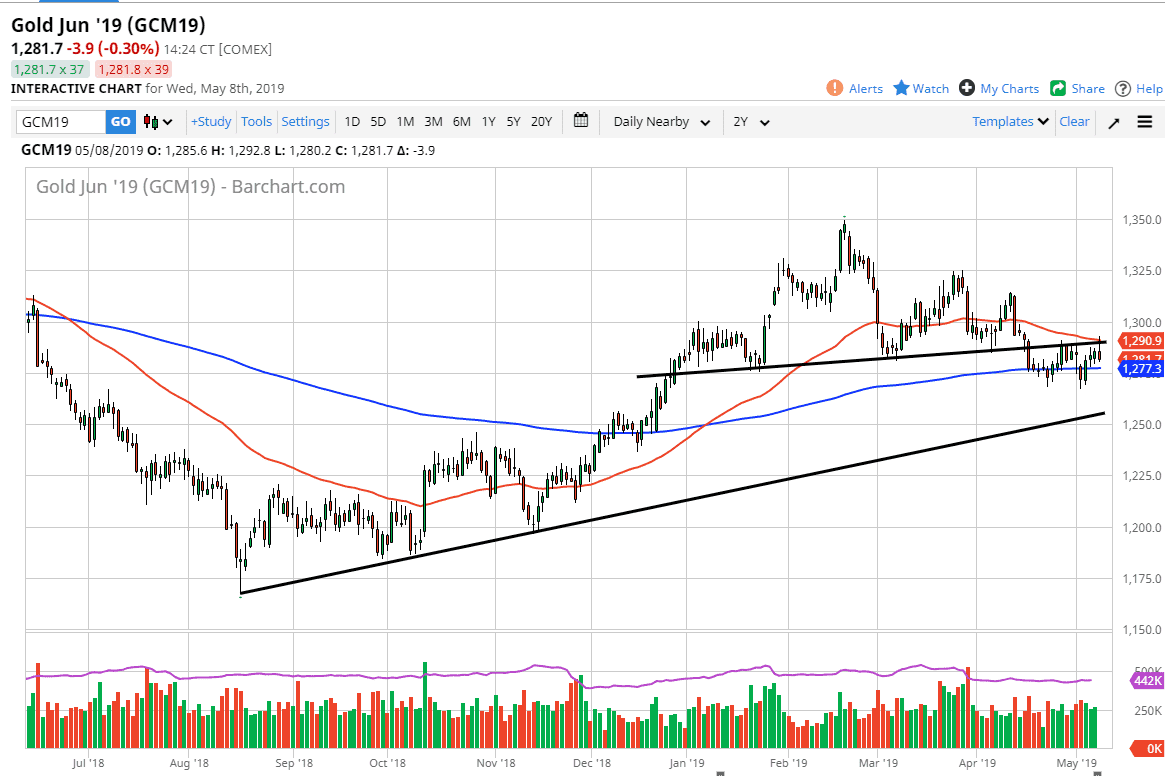
The Gold markets rallied a bit during the trading session on Wednesday but found resistance at the 50 day EMA as we have seen before, and more importantly have shown resistance where the neckline of the previous head and shoulders pattern had formed. Because of this, it looks as if the sellers are starting to step in and take advantage of the technical pattern and the resistance above.
The 50 day EMA is an area that of course will attract a lot of technical interest, but the fact that it coincided nicely with the neckline of the head and shoulders pattern was even more interesting for a lot of traders. As I watched this play out during the trading session in real time, we initially shot above the neck line rather quickly, but a flood of selling orders came back into the marketplace almost immediately. At one point it was something like 4 to 1 in favor of sellers.
By forming the candle stick that we have, it suggests that we are going to continue to rollover. I do recognize that the 200 day EMA underneath at the $1277 level will continue to offer support, just as the $1268 level will but it’s obvious that the momentum is to the downside.
The way I am playing this market is shorting small time frame rallies that show signs of exhaustion. I do not think that we will be able to break above the top of the candle stick for the day, but if we did it would obviously be a very bullish sign. However I believe that we have more pressure to the downside that up, so I fully anticipate that the sellers will eventually take over. Pay attention to the US dollar, because if it strengthens that could be a catalyst to send this market lower as well.

