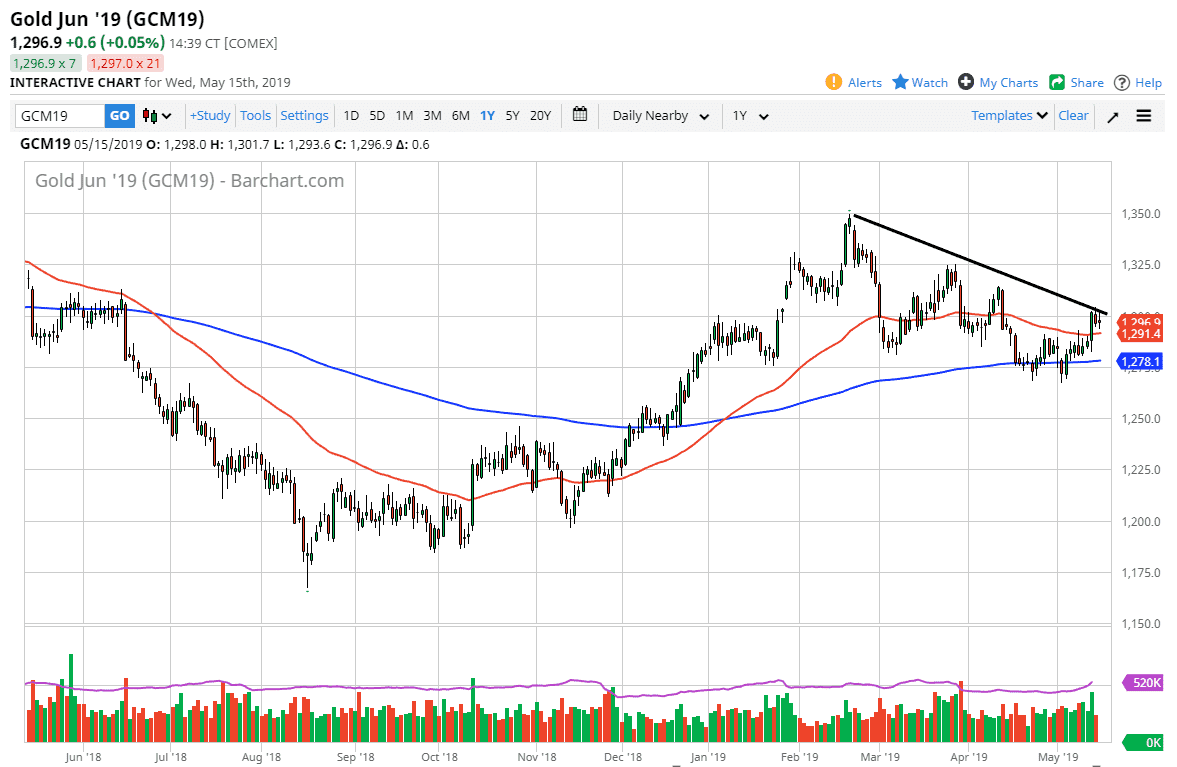
Gold markets went back and forth during the trading session on Wednesday, as we are testing a major downtrend line. That downtrend line of course will attract a lot of attention, just as the significant $1300 level will. With that being the case, we went back and forth to form a bit of a neutral candle stick, which suggests that we are having to rethink the entire situation. After this significant rally of the last couple of days, that’s actually a very bearish sign.
The 50 day EMA is sitting just below, so that does offer a bit of support, but it also would bring in a lot of selling if we were to break below it as algorithmic traders will start shorting again. The recent extraordinarily strong green candle stick was at the same time that we had seen the S&P 500 melt down, so keep in mind that is a little bit of impulsivity more than anything else. As the S&P 500 has recovered over the last couple of days, the markets went back and forth in the gold pits, but really didn’t do much more than that. It tells you that there isn’t a lot of underlying demand for gold unless there is significant panic.
Looking at this chart, if we do break down below the 50 day EMA, it’s very likely that we go to the 200 day EMA at the $1278 level. The alternate scenario is that we break above the $1305 level, and then go looking towards $1315 level, perhaps even the $1325 level. That being said, pay attention to the risk appetite of stock markets, it will probably dictate where we go next and certainly shows where the money will flow as far as fear or greed is concerned.

