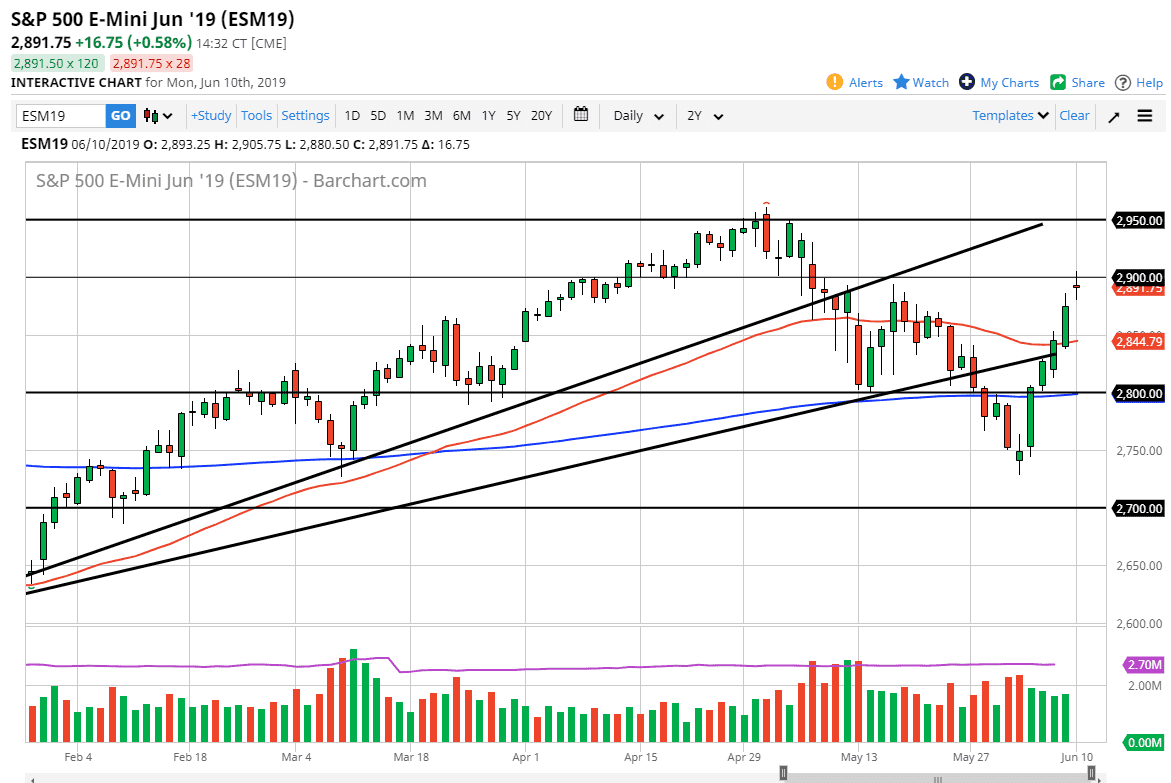
S&P 500
The S&P 500 gapped a bit higher during the trading session on Monday, and then broke above the 2900 level in the E-mini contract. This was a significant turn of events, but even more important was the fact that we turned around to show signs of exhaustion. By finishing the candlestick in a neutral or even slightly negative manner, it looks as if the 2900 level could offer a bit of a short-term ceiling. The question now is whether or not we break higher or lower. This is simply going to be a “binary event”, meaning that a break above the candle stick for the trading session is a bullish sign, just as a break down below the bottom of the candle stick is a bearish sign. The market has a lot of different things to digest right now, and at the very least we need to pull back a little bit.
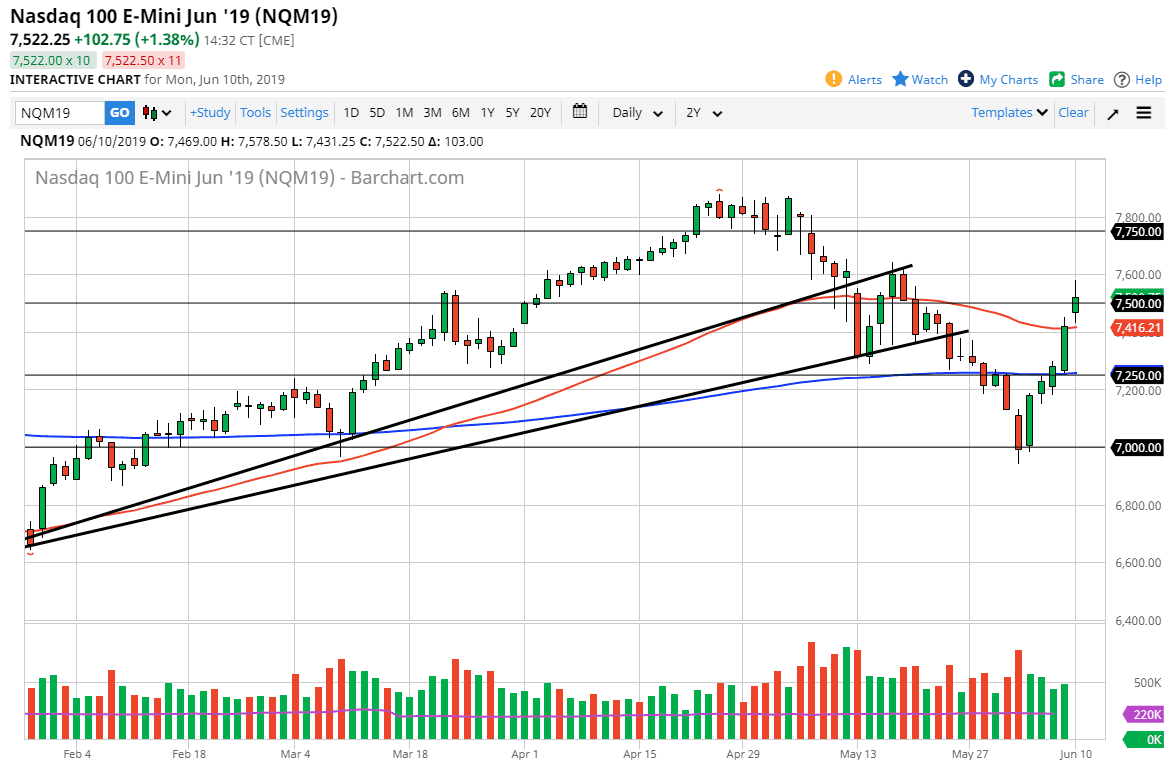
NASDAQ 100
The NASDAQ 100 rallied significantly after gapping above the 50 day EMA as well. Not only that, we broke above the 7500 level and almost reached the 7600 level. With that being the case, we then found sellers and turned around of form a bit of a less than impressive candlestick. The 7600 level being broken to the upside would be a very bullish sign, but I think at this point we are likely to see more consolidation than anything else. The NASDAQ 100 is highly sensitive to the US/China trade situation, so pay attention to that as well.
At this point, the question then becomes whether or not we can continue to go higher, or if we fall. If we get a daily close below the 50 day EMA, then I think the downtrend over the last couple of months continues. However, if we break above 7600, then I think we go looking towards 7750.


