S&P 500
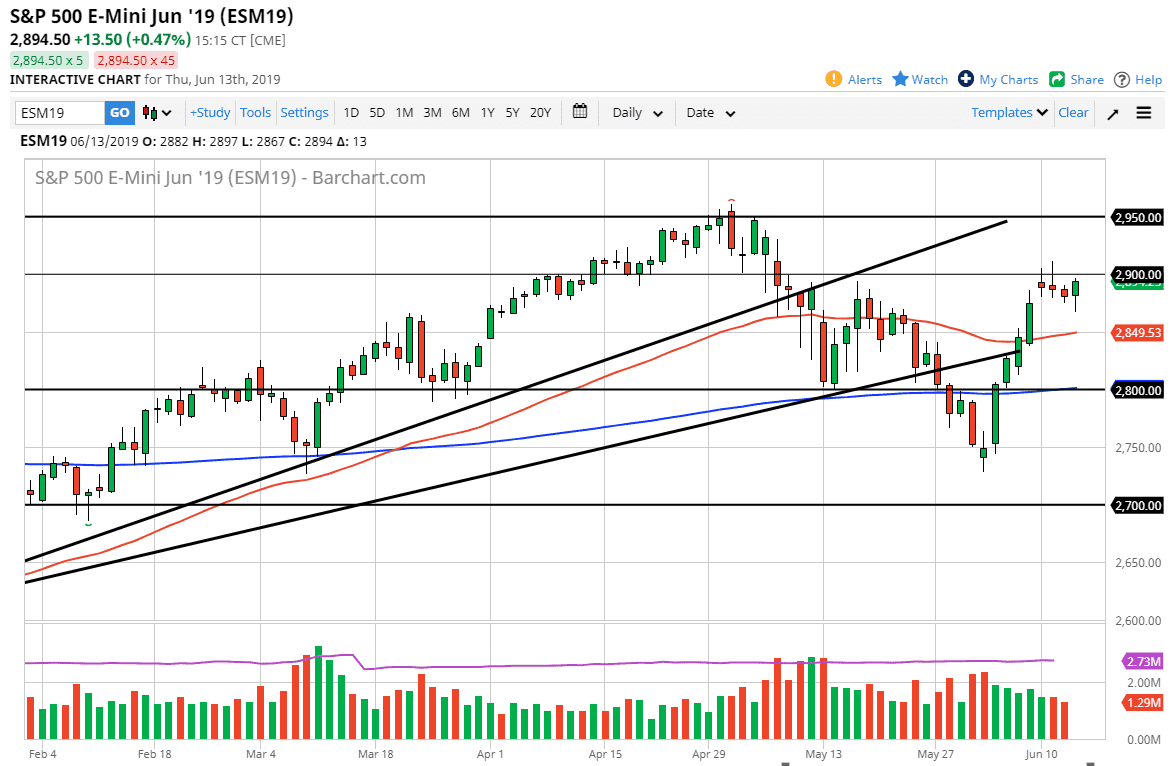
The S&P 500 initially fell during trading on Thursday but found enough support underneath the turn around and form a reasonably bullish candle stick. By doing so, it looks as if the market is trying to find its way, and therefore if we continue to see a lot of noise in the market it makes sense that we could continue to be a bit confused. This entire week has been a mess and I don’t see that changing anytime soon. However, if we can break above the top of the candle stick from the Tuesday session that could give the “all clear” for this market to go looking towards the 2950 handle. Ultimately, if we break down below the lows of the Wednesday session, I think we are probably going to continue to go a bit lower. On a break down from here we will probably go looking towards the 50 day EMA.
NASDAQ 100
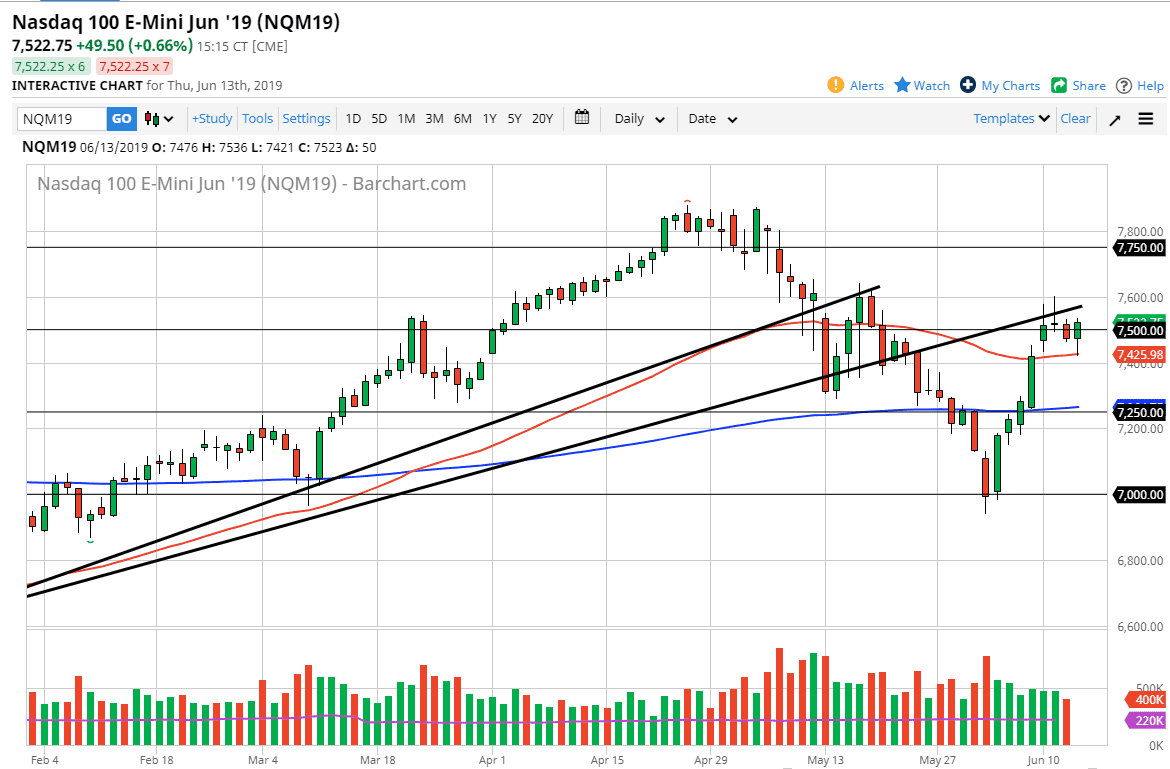
The NASDAQ 100 also pulled back towards the 50 day EMA on the chart, but then turned around to form a bit of a hammer. That being the case, the market looks likely to continue to go back and forth between here and the 7600 level, and as we are right in the middle of it makes sense that we will see a lot of choppiness. This is a market that is highly sensitive to the US/China trade relations, which of course are all over the place. A breakout above the 7600 level should send this market higher, perhaps towards the 7750 level. Ultimately, if we break down below the 50 day EMA, then we would probably go looking towards the 7250 handle. Ultimately, this is a market that continues to test nerves.


