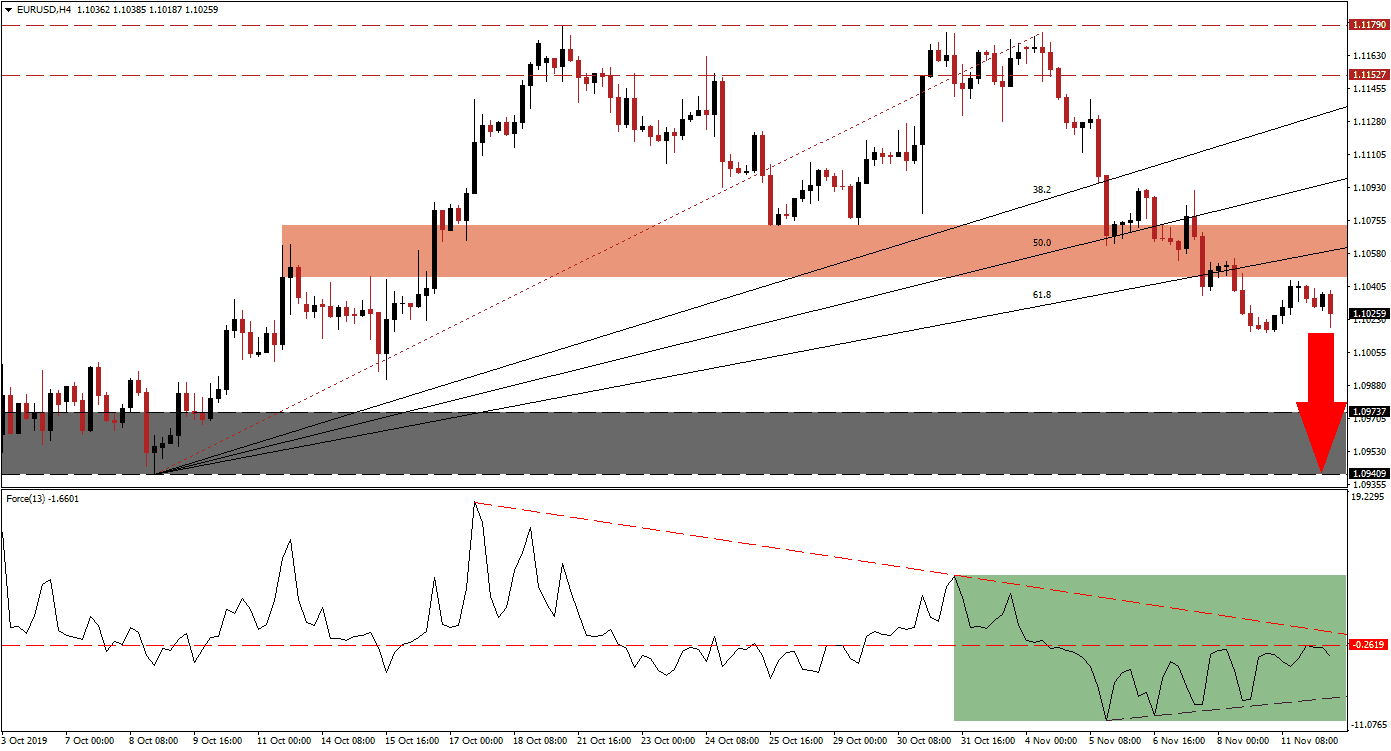
As the Eurozone economy is poised for more weakness in the years ahead, analysts try to determine how low the EUR/USD may fall. Repeated calls for parity have emerged, but the US economy is facing a series of fundamental issues that may provide a floor under this currency pair. Price action just completed a breakdown below its ascending 61.8 Fibonacci Retracement Fan Support Level and turned it into resistance, on the back of a rise in bearish momentum. This has cleared to path into its support zone from where a short-term breakdown may follow. You can learn more about the Fibonacci Retracement Fan here.
The Force Index, a next-generation technical indicator, indicates the rise in bearish momentum which accompanied the breakdown sequence in the EUR/USD. While a positive divergence formed, a bullish development, bearish fundamental factors are countering it. After the breakdown in this currency pair below its 61.8 Fibonacci Retracement Fan Support Level, the Force Index drifter higher and into its horizontal resistance level which rejected a further advance as marked by the green rectangle. The descending resistance level is now expected to push this technical indicator below its ascending support level and lead to more downside.
Following the breakdown in the EUR/USD below its long-term resistance zone, located between 1.11527 and 1.11790, price action crashed through its entire Fibonacci Retracement Fan sequence and turned it into resistance. The converted 61.8 Fibonacci Retracement Fan Resistance Level enforced the short-term support zone but was unable to halt the sell-off which turned it into a resistance zone. This zone is located between 1.10455 and 1.10731 as marked by the red rectangle. You can learn more about the support and resistance zones here.
Bearish momentum continues to rise and the EUR/USD is expected to move into its support zone which is located between 1.09409 and 1.09737 as marked by the grey rectangle. A breakdown below this zone cannot be ruled out, but a fresh fundamental catalyst is required to sustain it. The next support zone awaits price action between 1.08789 and 1.09039 which represents a two-and-a-half-year low and given the structural weaknesses which appear in the US economy, this may represent the end of the downside potential in this currency pair.
EUR/USD Technical Trading Set-Up - Breakdown Extension Scenario
⦁ Short Entry @ 1.10250
⦁ Take Profit @ 1.09450
⦁ Stop Loss @ 1.10450
⦁ Downside Potential: 80 pips
⦁ Upside Risk: 20 pips
⦁ Risk/Reward Ratio: 4.00
In case the Force Index can complete and maintain a breakout above its descending resistance level, the EUR/USD may follow suit with a breakout of its own which may be limited to the bottom range of its long-term resistance zone. While the long-term fundamental picture suggests an increase in price action from current levels, the short-term technical scenario points towards an extension of the breakdown into its support zone.
EUR/USD Technical Trading Set-Up - Breakout Scenario
⦁ Long Entry @ 1.10800
⦁ Take Profit @ 1.11500
⦁ Stop Loss @ 1.10500
⦁ Upside Potential: 70 pips
⦁ Downside Risk: 30 pips
⦁ Risk/Reward Ratio: 2.33

