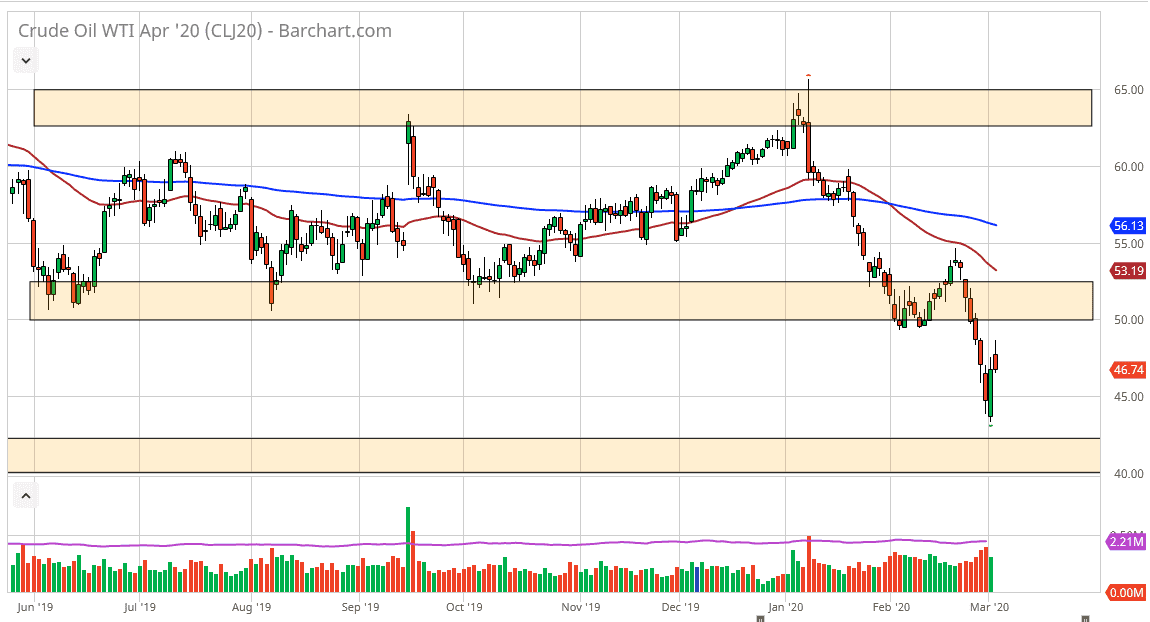
The West Texas Intermediate Crude Oil market gapped to kick off the trading session to the upside on Tuesday, and then took off even further as the Federal Reserve ended up cutting rates by 50 basis points in a certain matter of surprise. That being said, the markets initially sold the US dollar off rather stringently but at the end of the day the reality is very unlikely to suddenly see a massive amount of demand come into the marketplace just because the Federal Reserve cut rates. In normal circumstances, yes it would work but we are not under normal circumstances.
The major problem is that demand is paltry and will remain so through the coronavirus situation. Beyond that, traders will begin to wonder what it is that the Federal Reserve knows that the rest of the world doesn’t when it comes to the economy. I suspect that as long as the $50 level above will continue to be an area where people pay attention to for a potential selling opportunity, and that’s assuming that we even get there. With that in mind, it’s very likely that we will continue to see a lot of back and forth but there is still more downside than up than anything else. The $50 level being broken to the upside would be rather important, but there is a whole range of resistance and I think at this point it’s very unlikely to see a major change.
I anticipate that this rally will fade right back into oblivion and traders will look to go down towards the lows again, perhaps even as low as $40. Any rally at this point will simply invite more selling and I think should be looked at as an opportunity to get short of a market that has no business rallying for any significant amount of time. It’s not until we break above the 50 day EMA that I would be interested in going long for a bigger move, and I think we are a long way away from that happening. Fading rallies on short-term charts continues to work but I also suspect that you will probably be looking at a lot of volatility going forward, which will be the same in multiple other markets. Using the daily chart as a guide, you can fade short-term rallies from what I see.

