China reported few new Covid-19 infections for several months before a new cluster appeared in Beijing. It sparked fears of a resurgence of the virus in China, where the global spread originated in Wuhan province. Economic data for May disappointed, suggesting the government’s soft reboot of economic activity will result in a slow recovery. While misplaced optimism for a V-shaped global recovery remains, it is fading quickly. Financial markets, particularly the equity segment, have not adjusted to it. The US Dollar is under intensifying selling pressure, as evident in the USD/CNH sell-off. With the ongoing trade war between the US and China, a new breakout sequence is probable, defying US Dollar weakness.
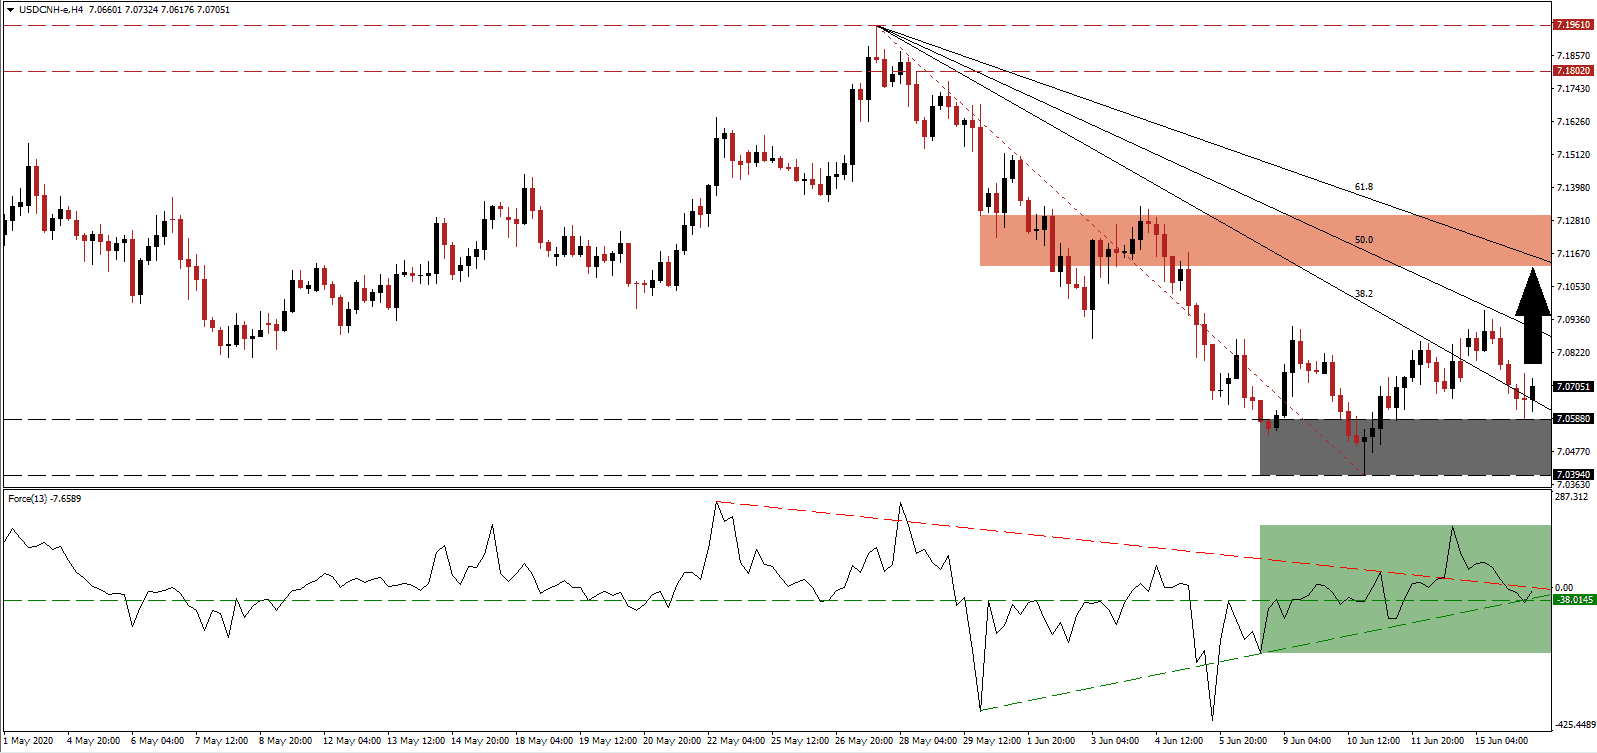
The Force Index, a next-generation technical indicator, gradually strengthened with a series of higher lows, confirming bullish momentum accumulation. After the ascending support level assisted a breakout above its horizontal resistance level, converting it into support, as marked by the green rectangle, a spike through its descending resistance level followed. This technical indicator partially reversed the advance but has since stabilized with bulls awaiting a renewed crossover above the 0 center-line to resume control of the USD/CNH.
Retail sales and fixed asset investment out of China fell short of expectations, extending monthly contractions. Industrial production increased, but at a slower pace than expected. Gains were fueled by the preferred crisis approach of the Chinese government, centered around local and municipal government spending on infrastructure projects. China will also sell 元1 trillion of specific Treasury bonds to partially fund the economic stimulus in response to the Covid-19 pandemic. The USD/CNH is well-positioned to use its support zone located between 7.0394 and 7.0588, as marked by the grey rectangle, as a platform for a short-covering rally.
Criticism that the Chinese Yuan is manipulated by the People’s Bank of China to maintain a competitive advantage, especially by the US, have dominated. The 7.0000 level was once a coveted resistance, but since US President Trump initiated a trade war, the Chinese government allowed the USD/CNH to advance. By honoring its commitment to more flexibility, the timing is providing an edge to its export industry. Price action is expected to spike into its short-term resistance zone located between 7.1123 and 7.1299, as identified by the red rectangle. The descending 61.8 Fibonacci Retracement Fan Resistance Level is on the verge of crossing the bottom range of it, likely challenging a further advance.
USD/CNH Technical Trading Set-Up - Short-Covering Scenario
Long Entry @ 7.0700
Take Profit @ 7.1120
Stop Loss @ 7.0560
Upside Potential: 420 pips
Downside Risk: 140 pips
Risk/Reward Ratio: 3.00
Should the Force Index collapse below its ascending support level, the USD/CNH is favored to extend its corrective phase. Intensifying economic stress out of the US, the surge in new Covid-19 infections, and the potential of more debt-funded stimulus are adding to breakdown pressures in this currency pair. Volatility is anticipated to increase, while the next support zone awaits price action between 6.9528 and 6.9826.
USD/CNH Technical Trading Set-Up - Breakdown Scenario
Short Entry @ 7.0360
Take Profit @ 6.9820
Stop Loss @ 7.0560
Downside Potential: 540 pips
Upside Risk: 200 pips
Risk/Reward Ratio: 2.70

