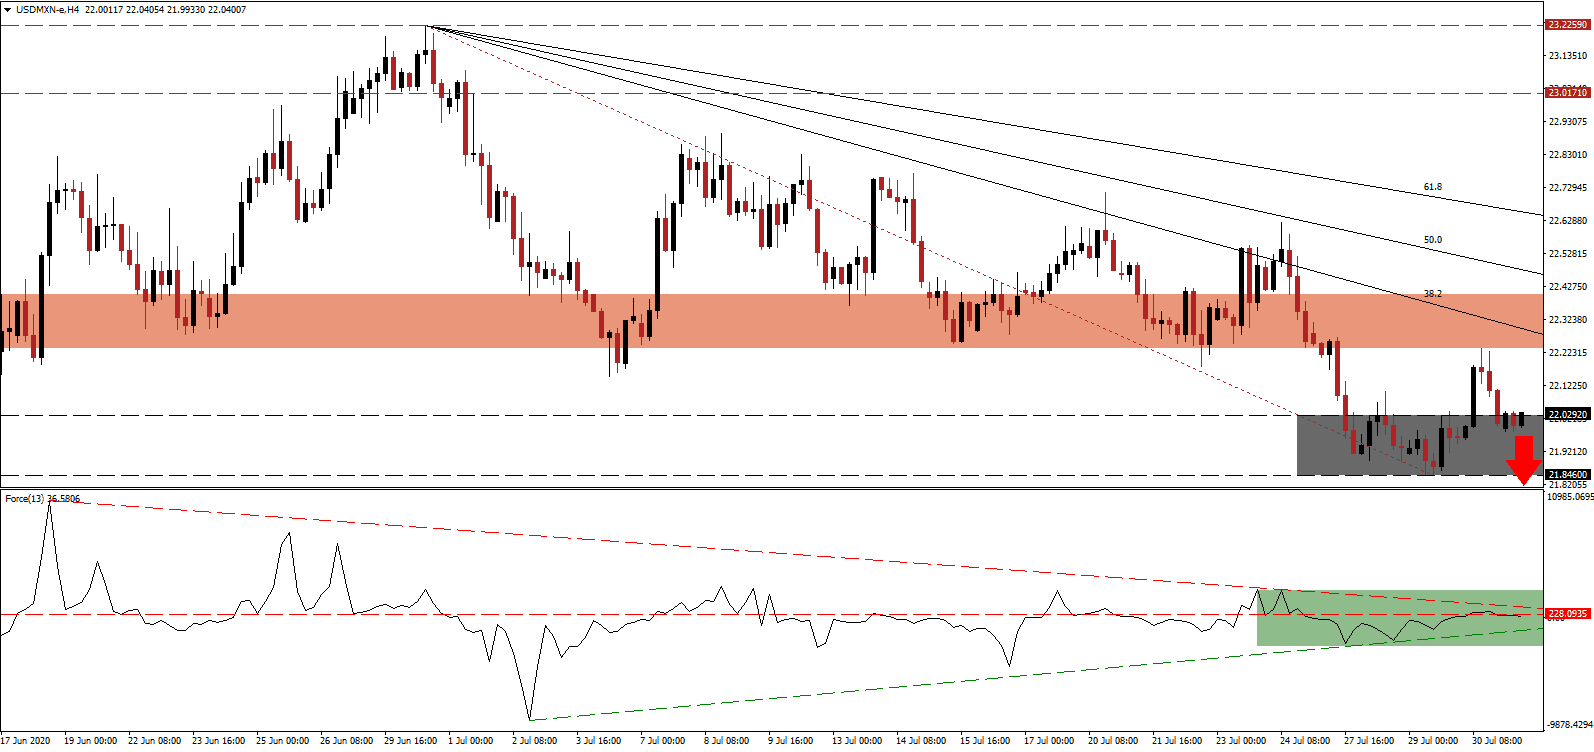
Mexico reported its fifth consecutive GDP contraction with a historic 18.9% drop in the second quarter. The primary sector slid 0.3%, the secondary plunged by 26.0%, and the tertiary by 15.6%. It followed the 2.2% first-quarter GDP decrease. By comparison, the US reported a second-quarter collapse of 32.9% and a first-quarter drop of 5.0%. The USD/MXN was rejected by the bottom range of its short-term resistance zone and has entered its support zone with an expansion in bearish pressures, driven by US Dollar weakness.
The Force Index, a next-generation technical indicator, confirms the dominance of bearish momentum after moving below its horizontal resistance level, as marked by the green rectangle. Expanding downside pressure is the descending resistance level, favored to guide this technical indicator below its ascending support level and into negative territory. It will allow bears to regain complete control of the USD/MXN.
Per the Mexican Social Security Institute (IMSS), the economy lost 1,113,677 formal jobs in the first six months of 2020. Jonathan Heath, the Deputy Governor of Banxico, did note that total job losses, including informal jobs and government positions, totaled more than 12,000,000, supported by data from the Instituto Nacional de Estadística y Geografía (INEGI). With the US labor market in dire shape and not expected to recover fully for years, the rejection in the USD/MXN by its short-term resistance zone located between 22.2371 and 22.4000, as marked by the red rectangle, is anticipated to lead to a breakdown extension.
President López Obrador claims there will be no job losses in the final week of July and confirmed that the economy has to enter a V-shaped recovery. He continues to promote his mega infrastructure projects as the way forward, while the government is actively seeking US companies with manufacturing in China and Vietnam to relocate to Mexico. While uncertainty surrounds the Mexican economy, the issues are trumped in the US. The descending 38.2 Fibonacci Retracement Fan Resistance Level is likely to force the USD/MXN below its support zone located between 21.8460 and 22.0292, as identified by the grey rectangle. Price action will face its next support zone between 19.8919 and 20.2760.
USD/MXN Technical Trading Set-Up - Breakdown Extension Scenario
Short Entry @ 22.0300
Take Profit @ 19.9300
Stop Loss @ 22.4300
Downside Potential: 21,000 pips
Upside Risk: 4,000 pips
Risk/Reward Ratio: 5.25
A reversal in the Force Index, inspired by its ascending support level, could lead the USD/MXN into a temporary price spike. Given the materially worsening outlook for the US economy and the US Dollar, Forex traders are advised to consider any advance as a secondary selling opportunity. The upside potential remains confined to its 61.8 Fibonacci Retracement Fan Resistance Level.
USD/MXN Technical Trading Set-Up - Confined Breakout Scenario
Long Entry @ 22.5300
Take Profit @ 22.6300
Stop Loss @ 22.4700
Upside Potential: 1,000 pips
Downside Risk: 500 pips
Risk/Reward Ratio: 2.00

