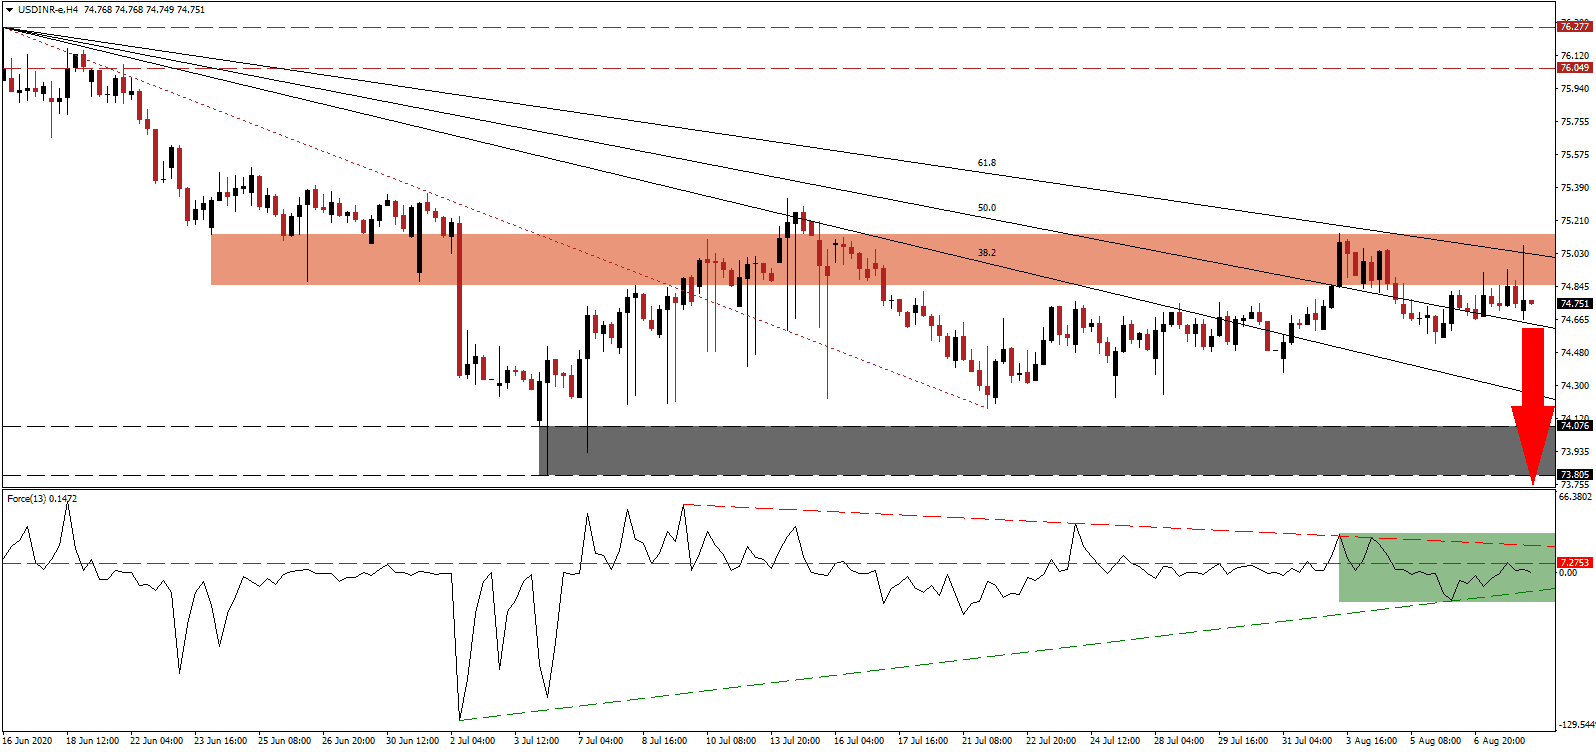
While the US and Brazil exceeded 5,000,000 and 3,000,000 Covid-19 infections over the weekend, India crossed the 2,000,000 level. Global confirmed cases now total over 20,000,000, with the three most-infected countries accounting for over 50% of all cases. After the Reserve Bank of India (RBI) surprised markets by not lowering interest rates last Thursday, it added to it by withholding its GDP outlook for the shortened financial year ending March 2021. Economists forecast a contraction as high as 9.5%, led by a 20.0% plunge in the June-quarter. Price action in the USD/INR was rejected inside of its resistance zone from where a new breakdown sequence is favored to materialize.
The Force Index, a next-generation technical indicator confirms the dominance of bearish momentum and remains below its horizontal resistance level. Adding to downside pressures is its descending resistance level, as marked by the green rectangle, expected to push this technical indicator below its ascending support level. Bears wait for a collapse into negative territory to regain complete control over the USD/INR.
Business and consumer confidence remain depressed with a negative outlook. Orders, inventories, and capacity utilization all confirm weak domestic demand, but the RBI has little room to assist due to headline retail inflation, which remains above 6%. Per the RBI Act, the figure is allowed to range between 2% and 6%. Three consecutive quarters above 6% will trigger a provision forcing the RBI Governor to explain to the government why the central bank failed to contain inflation. It adds a bearish catalyst for the USD/INR, rejected by its descending 61.8 Fibonacci Retracement Fan Resistance Level, inside of its short-term resistance zone located between 74.851 and 75.133, as identified by the red rectangle.
India continues to add to its record foreign currency reserves, now the fifth-largest in the world. They increased by $11.9 billion in July to $534.5 billion. The uptrend started after Finance Minister Nirmala Sitharaman announced a sharp decrease in the corporate tax rate in September 2019, which resulted in a surge in foreign direct investment (FDI). The USD/INR is likely to accelerate into its support zone located between 73.805 and 74.076, as marked by the grey rectangle. An extension into its next support zone between 72.433 and 73.214 remains a probability.
USD/INR Technical Trading Set-Up - Breakdown Scenario
Short Entry @ 74.750
Take Profit @ 73.000
Stop Loss @ 75.200
Downside Potential: 17,500 pips
Upside Risk: 4,500 pips
Risk/Reward Ratio: 3.89
A breakout in the Force Index above its descending resistance level can lead the USD/INR into a temporary push higher. While US President Trump signed four executive orders, including $400 in weekly subsidies to the unemployed, the labor market is slowing, and job cuts surged in July. The economic outlook for the US remains bearish, and Forex traders should consider any advance as a selling opportunity, with the next resistance zone located between 76.049 and 76.277.
USD/INR Technical Trading Set-Up - Confined Breakout Scenario
Long Entry @ 75.550
Take Profit @ 76.050
Stop Loss @ 75.200
Upside Potential: 5,000 pips
Downside Risk: 3,500 pips
Risk/Reward Ratio: 1.43

