India continues to lead new daily Covid-19 infections globally while the economic rebound witnessed in May and June has lost momentum. With the economy forecast to plunge by as much as 25.7% in the second quarter, Prime Minister Narendra Modi is under intensifying to deliver a sustainable path to recovery. The manufacturing sector collapsed by 40.7% year-over-year in the first quarter, and service sector activity is depressed. ICRA, the independent Indian credit rating agency, believes the increase in government expenditures will support economic performance moving forward. The USD/INR embarked on a counter-trend breakout, but bearish momentum remains elevated.
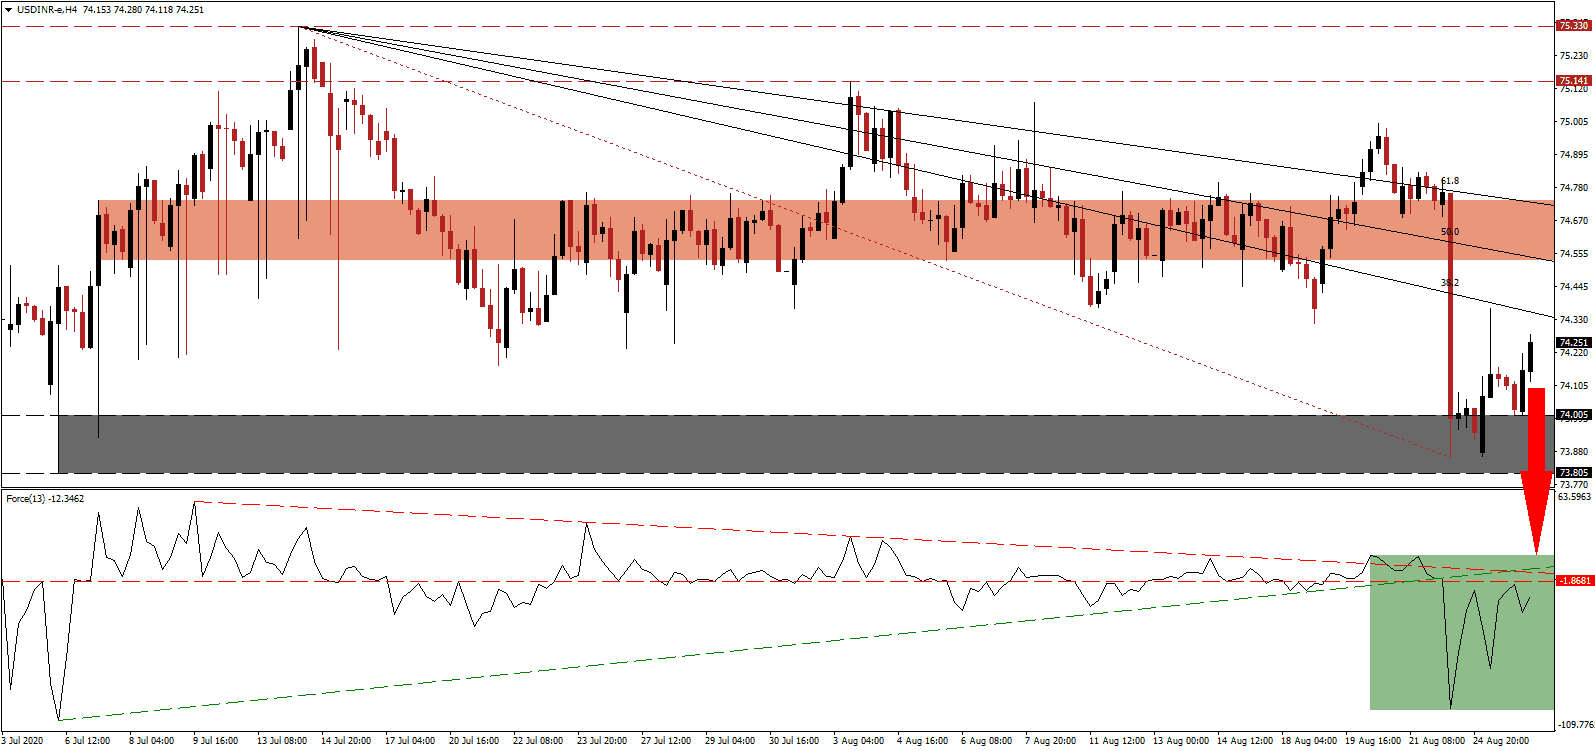
The Force Index, a next-generation technical indicator, recovered from a multi-week low but is faced with rejection by its horizontal resistance level. It also maintains its position below the ascending support level, as marked by the green rectangle, while the descending resistance level expands breakdown pressures. Bears remain in full control over the USD/INR with this technical indicator below the 0 center-line.
Privatization of the Indian economy remains a core element to unlock the potential of the economy, but concerns over the implementation exist. After the government announced the sale of six regional airports, control went to billionaire and loyal Modi-supported Gautam Adani. He is set to add to his airport monopoly by adding two more. Centralized privatization is counter-productive, which needs to be addressed. Bearish pressures in the USD/INR remain intact following the breakout above its support zone located between 73.805 and 74.005, as marked by the grey rectangle.
Per the Annual Report of the Reserve Bank of India (RBI), the economy will face a prolonged period of stress related to the Covid-19 pandemic. Localized lockdowns are adding to a slowdown in high-frequency indicators, as evidenced in July and August. The central bank added that public finances are exhausted, and support-led measures will diminish. With the US Dollar under more severe issues, the descending Fibonacci Retracement Fan sequence, crossing through the short-term resistance zone located between 74.533 and 74.735, as identified by the red rectangle, is well-positioned to force a reject price action. A collapse into its next support zone between 72.702 and 73.214 is favored.
USD/INR Technical Trading Set-Up - Breakdown Resumption Scenario
Short Entry @ 74.250
Take Profit @ 72.750
Stop Loss @ 74.600
Downside Potential: 15,000 pips
Upside Risk: 3,500 pips
Risk/Reward Ratio: 4.29
In case the Force Index pushed above its ascending support level, serving as resistance, the USD/INR could temporarily seek more upside. With the US labor market under stress, government assistance shrinking, and debt rising, the US Dollar maintains its bearish bias. The upside potential remains confined to its lowered long-term resistance zone between 75.141 and 75.330. Forex traders should consider this a selling opportunity.
USD/INR Technical Trading Set-Up - Confined Breakout Extension Scenario
Long Entry @ 74.850
Take Profit @ 75.150
Stop Loss @ 74.600
Upside Potential: 3,000 pips
Downside Risk: 2,500 pips
Risk/Reward Ratio: 1.20

