Mexico remains the eight-most infected Covid-19 country globally and has the fourth-highest death toll. While the numbers remain elevated, they started to trend lower. The Instituto Nacional de Estadística y Geografía (INEGI) reported an 18.7% plunge in second-quarter GDP, the worst reading since the 1929 Great Depression. Before the global Covid-19 pandemic forced the economy into hibernation, Mexico already struggled with a recession. The economy shrank by 0.3% in 2019, with forecasts for 2020 ranging for a contraction between 9.0% and 12.8%. US Dollar weakness trumps medium-term concerns in Mexico, and the USD/MXN is well-positioned for a breakdown below its support zone.
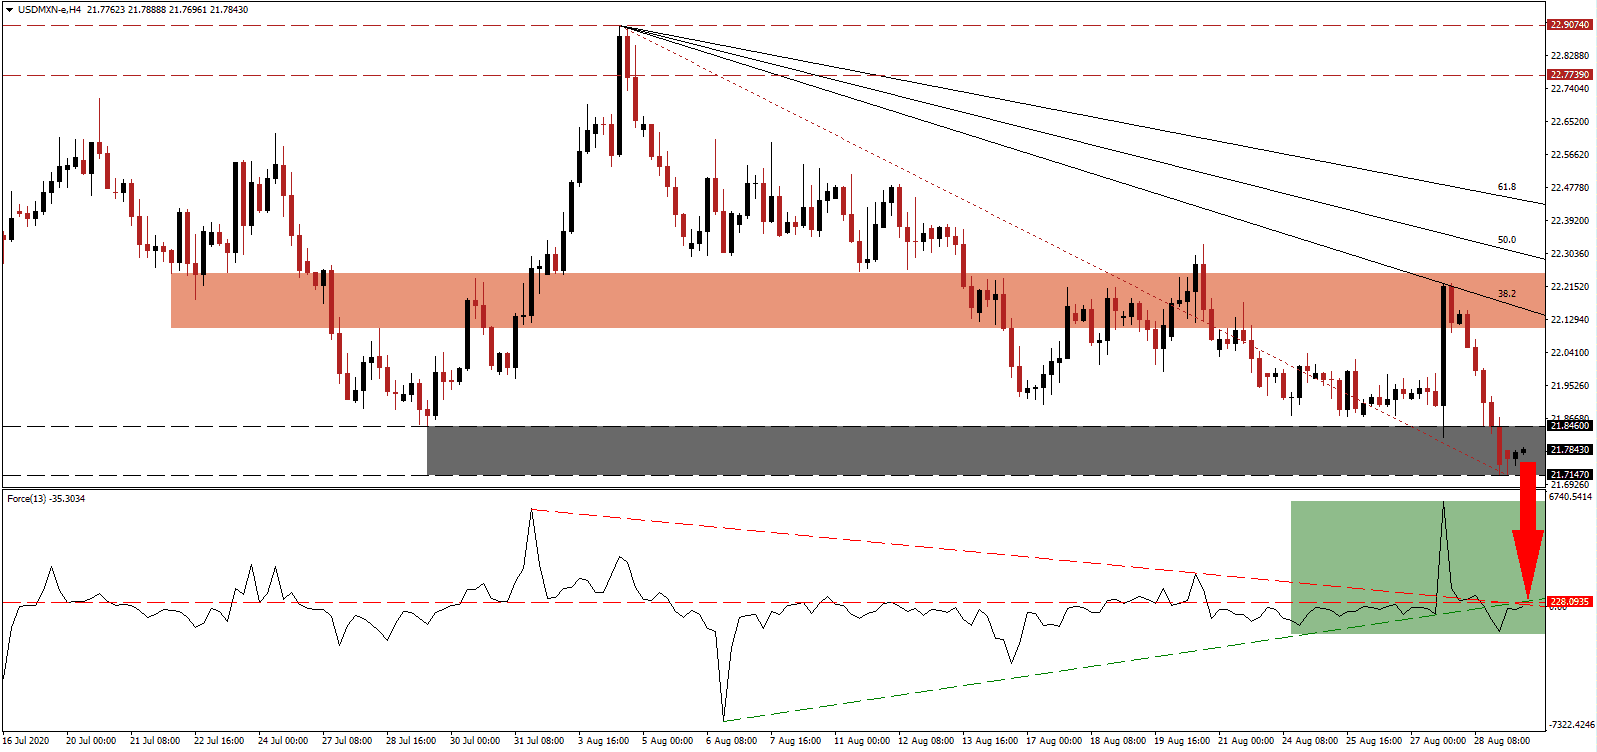
The Force Index, a next-generation technical indicator, confirms bearish momentum following the breakdown below its ascending support level, as marked by the green rectangle. It remains below its horizontal resistance level, with the descending resistance level expanding downside pressures. Bears are in complete control over the USD/MXN, favored to accelerate its correction.
Per data from INEGI, primary activities, which include the agricultural sector, decreased by 0.2%, secondary ones, consisting of mining, manufacturing, and construction, plunged by 25.7%, and tertiary ones, dominated by the service sector and retail sales, dropped by 16.2%. President López Obrador insists that the economy started to recover, citing the 8.9% bounce registered in June over May. The USD/MXN ended its counter-trend advance with a lower high inside of its downward revised short-term resistance zone located between 22.1039 and 22.2497, as identified by the red rectangle.
While the US spiked its unsustainable debt load further, increasing bearish pressures on the US Dollar and annual interest payments exceeding $1 trillion, Mexican President López Obrador maintains a comparably fiscal conservative stance. He resisted pressures to assist struggling companies and executed his long-term plan. The USD/MXN plunged to a lower low inside of its shifted support zone located between 21.7147 and 21.8460, as marked by the grey rectangle. More downside is expected, with the descending Fibonacci Retracement Fan sequence enforcing the well-established bearish chart pattern. The next support zone is located between 21.0833 and 21.3602.
USD/MXN Technical Trading Set-Up - Breakdown Extension Scenario
Short Entry @ 21.7850
Take Profit @ 21.0850
Stop Loss @ 21.9350
Downside Potential: 7,000 pips
Upside Risk: 1,500 pips
Risk/Reward Ratio: 4.67
A breakout in the Force Index above its ascending support level, serving as resistance, could result in a limited reversal in the USD/MXN. Given the intensifying bearish progress in the US Dollar and the depressed labor market, Forex traders should add to short-positions during any limited reversal. The upside potential is limited to its 50.0 Fibonacci Retracement Fan Resistance Level.
USD/MXN Technical Trading Set-Up - Limited Reversal Scenario
Long Entry @ 22.0350
Take Profit @ 22.1850
Stop Loss @ 21.9350
Upside Potential: 1,500 pips
Downside Risk: 1,000 pips
Risk/Reward Ratio: 1.50

