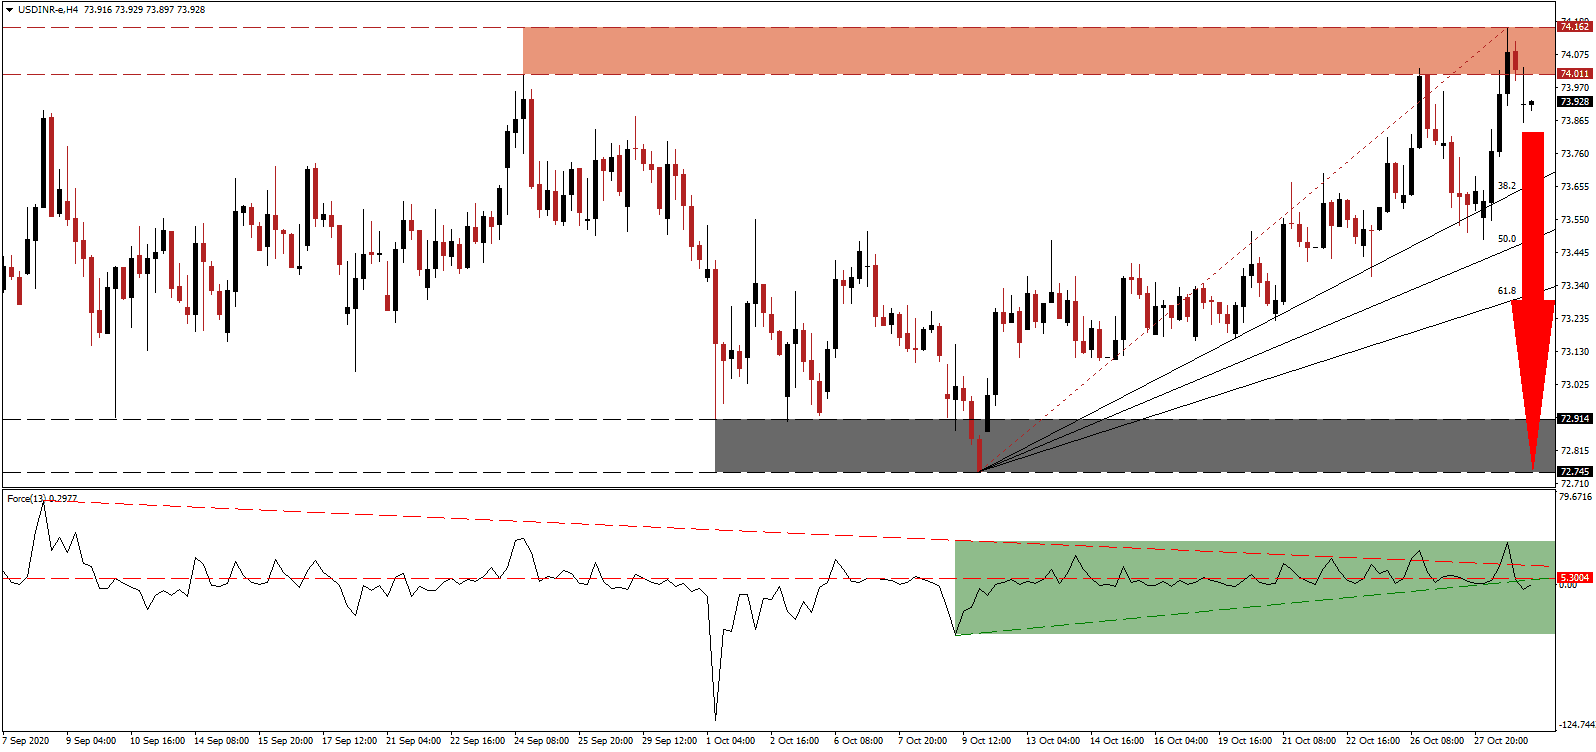
India crossed the 8,000,000 Covid-19 infection threshold while Prime Minister Narendra Modi assured all Indians would receive a vaccine. Answering questions after his speech, he pointed to a high recovery rate and rapidly falling active cases. He also noted the low death toll in respect to its population, despite having the second-highest tally globally. How the government plans to source a vaccine when it comes available for almost 1.4 billion people was not disclosed. The USD/INR briefly spike into its resistance zone before reversing.
The Force Index, a next-generation technical indicator, confirms the dominance of bearish momentum and remains below its horizontal resistance level. After a temporary spike above its descending resistance level, as marked by the green rectangle, it collapsed below its ascending support level. This technical indicator continues to slide deeper into negative territory, with bears in complete control over the USD/INR.
While tensions between India and China remain elevated, the latter was the primary buyer of finished steel exports between April and September, accounting for 29% of the total. Weak domestic demand related to the Covid-19 pandemic, Indian producers rely on Chinese buyers. It shows that economic decoupling plans by Prime Minister Modi are not viable. The breakdown in the USD/INR from its revised short-term resistance zone located between 74.011 and 74.162, as marked by the red rectangle, favored more downside.
High-frequency economic indicators improve, and the Indian industry body PHDCCI (Progress, Harmony and Development Chamber of Commerce and Industry) released its latest economic assessment. It calls for a 7.9% GDP contraction in the financial year 2020-2021, followed by a 7.7% rise in 2021-2022. PHDCCI suggested the government should focus on demand creation measures. A breakdown in the USD/INR below its 50.0 Fibonacci Retracement Fan Support Level will clear the path into its support zone located between 72.745 and 72.914, as identified by the grey rectangle.
USD/INR Technical Trading Set-Up - Breakdown Extension Scenario
- Short Entry @ 73.930
- Take Profit @ 72.750
- Stop Loss @ 74.130
- Downside Potential: 11,800 pips
- Upside Risk: 2,000 pips
- Risk/Reward Ratio: 5.90
Should the Force Index maintain an advance above its descending resistance level, the USD/INR could push for more upside. The upside potential remains limited to its intra-day high of 74.370, and Forex traders should sell any rallies. With a worsening economic outlook for the US, as part of a broader global recession, the US Dollar faces extended bearish pressures over the medium-term. High debt and weakening labor market fundamentals add to downside pressure.
USD/INR Technical Trading Set-Up - Limited Breakout Scenario
- Long Entry @ 74.230
- Take Profit @ 74.350
- Stop Loss @ 74.130
- Upside Potential: 1,200 pips
- Downside Risk: 1,000 pips
- Risk/Reward Ratio: 1.20

