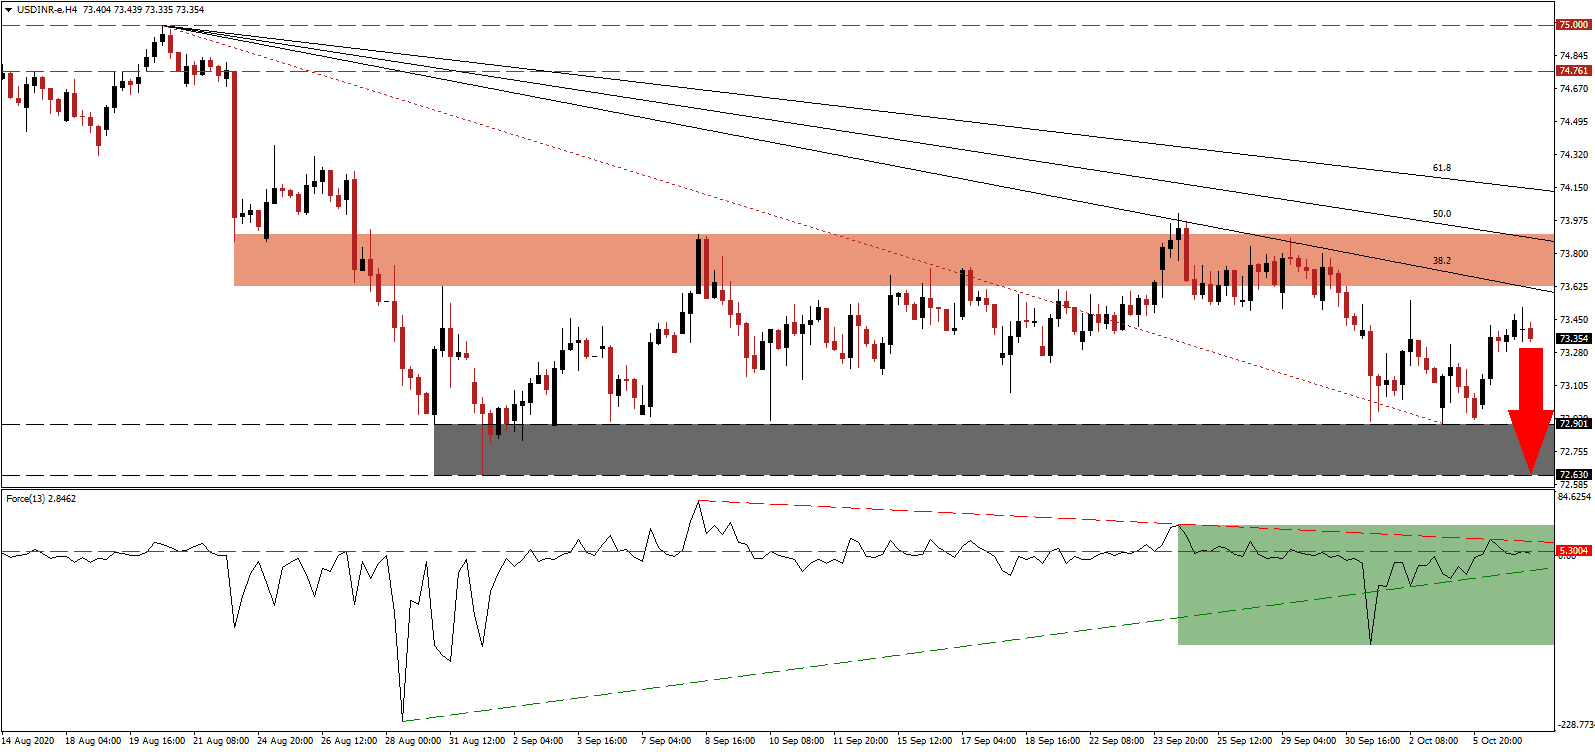
Despite the out-of-control Covid-19 pandemic across India, which leads the world in new daily infections, economic indicators point towards an ongoing post-lockdown recovery. The September services PMI improved to 49.8, just shy of the 50.0 level separating expansion and contraction. While the USD/INR embarked on a minor short-covering rally after approaching its support zone, bearish pressures remain in place. Adding to US Dollar downside momentum is the end of stimulus negotiations in the US, advised by President Trump. The bearish chart pattern for this currency pair remains dominant.
The Force Index, a next-generation technical indicator, advanced after recording a higher low, and briefly pierced above its horizontal resistance level. It was rejected by its descending resistance level, as marked by the green rectangle, and is now under downside pressure. A breakdown in this technical indicator through its ascending support level will take it below the 0 center-line, and grant bears full control over the USD/INR.
Adding to positive progress is the growing list of Indian executives expressing confidence in the economic prospects moving forward. The consensus is that the worst is behind India, and a slow but uneven recovery is possible. Rural growth, macro-economic and high-frequency indicators are the source of cautious optimism. Upside momentum in the USD/INR fizzled out after closing in on its short-term resistance zone located between 73.625 and 73.899, as marked by the red rectangle. The exhausted bullish momentum hints at more selling and a new breakdown sequence.
One primary concern remains the economic reforms of Prime Minister Narendra Modi, where progress is stagnant. The goods and services tax (GST), the bankruptcy and insolvency law, and the Monetary Policy Committee (MPC) are the most evident unresolved issues. Delayed payments to 28 states promised by the Modi-government add to concerns. The descending Fibonacci Retracement Fan Sequence is positioned to pressure the USD/INR into its support zone located between 72.630 and 72.901, as identified by the grey rectangle. More downside may emerge, driven by intensifying US Dollar weakness.
USD/INR Technical Trading Set-Up - Breakdown Extension Scenario
Short Entry @ 73.350
Take Profit @ 72.650
Stop Loss @ 73.550
Downside Potential: 7,000 pips
Upside Risk: 2,000 pips
Risk/Reward Ratio: 3.50
A breakout in the Force Index above its descending resistance level could lead the USD/INR into a brief price spike. The upside potential remains limited to its 61.8 Fibonacci Retracement Fan Resistance Level. With weakness in the labor market ongoing, consumer confidence is set to suffer, and a double-dip recession cannot be excluded. Political uncertainty adds to short-term worries, and Forex traders should sell any rallies.
USD/INR Technical Trading Set-Up - Limited Breakout Scenario
Long Entry @ 73.750
Take Profit @ 74.100
Stop Loss @ 73.550
Upside Potential: 3,500 pips
Downside Risk: 2,000 pips
Risk/Reward Ratio: 1.75

