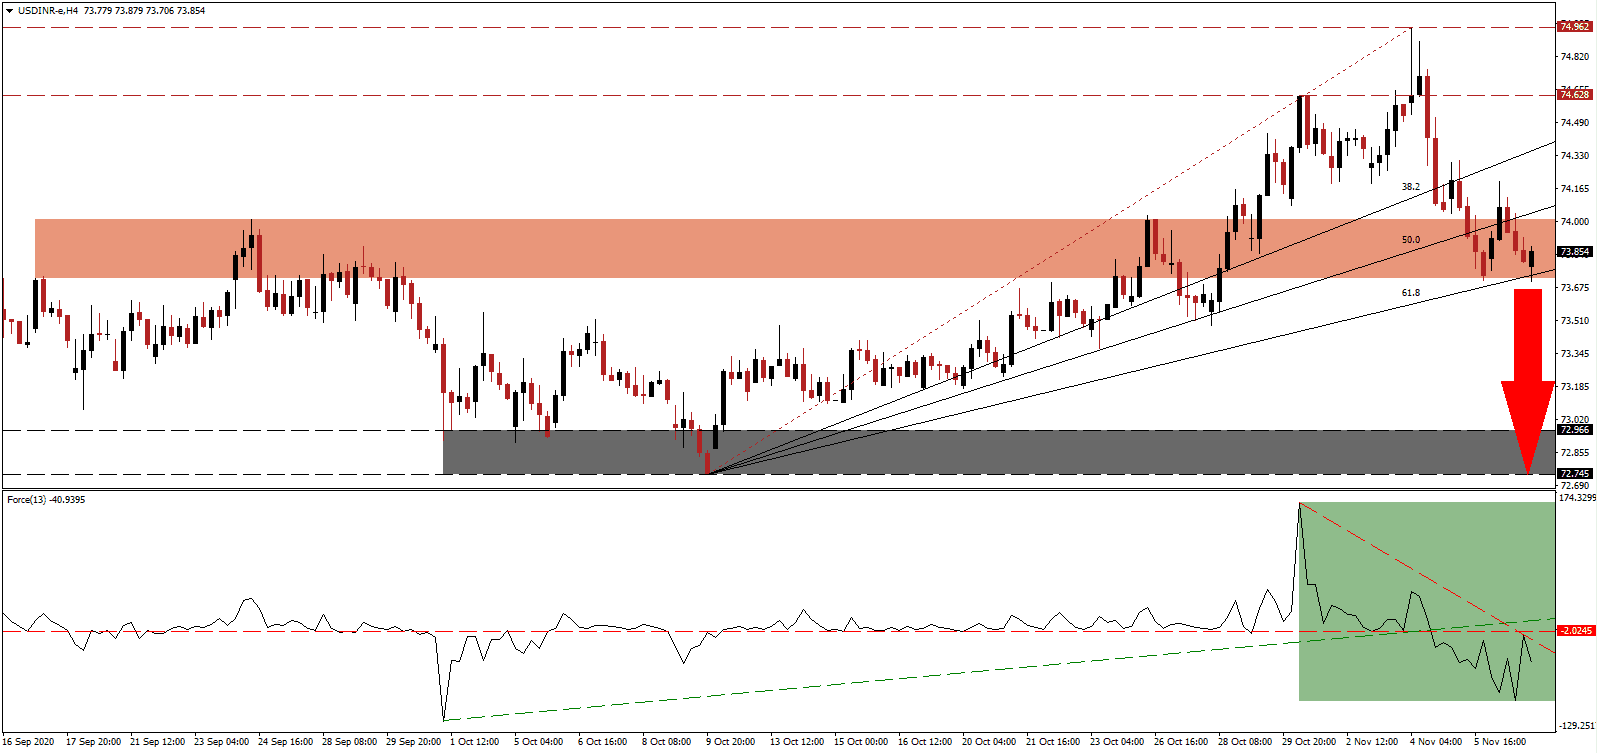
India faces the threat of a second COVID-19 wave, similar to Europe and the US, which could derail the current pace of recovery. While a report by India's Ministry of Finance suggested the economy may reach pre-COVID-19 levels by the end of the 2020-2021 fiscal year, it cautioned how a surge in infections is likely to impact the growth trajectory negatively. The USD/INR converted its short-term support zone into resistance, from where a breakdown can extend the correction.
The Force Index, a next-generation technical indicator, confirms the massive spike in bearish momentum after retreating from a multi-month peak. A negative divergence formed before the collapse below its ascending support level and its horizontal resistance level. Adding to downside pressure is the descending resistance level, as marked by the green rectangle. Bears regained complete control over the USD/INR after this technical indicator moved into negative territory.
With the COVID-19 pandemic disrupting supply chains, many governments took it as an opportunity to adjust them permanently, both via a domestic focus and new partnerships. One of the new initiatives consists of a collaboration between Australia, India, and Japan. The trio announced plans to offer an alternative to China and to include ASEAN members to the discussed framework for the Indo-Pacific region. After the reversal in the USD/INR, price action presently challenges its short-term resistance zone located between 73.720 and 74.011, as identified by the red rectangle.
High-frequency indicators suggest a pick-up in domestic demand, but the twelve largest ports in India reported a contraction in cargo traffic for the seventh consecutive month. It is down 12.43% in the period between April and October. The twelve government-controlled ports account for 61% of all cargo, and a slump in commodity demand persists. A breakdown in the USD/INR below its ascending 61.8 Fibonacci Retracement Fan Support Level will clear the path into its support zone between 72.745 and 72.966, as marked by the grey rectangle.
USD/INR Technical Trading Set-Up - Breakdown Continuation Scenario
Short Entry @ 73.850
Take Profit @ 72.750
Stop Loss @ 74.200
Downside Potential: 11,000 pips
Upside Risk: 3,500 pips
Risk/Reward Ratio: 3.14
A reversal in the Force Index above its ascending support level, serving as temporary resistance, may lead the USD/INR into a brief price spike. After Biden became the US president-elect, the focus will shift back to the economy, where more debt and a slow labor market recovery curtails economic potential. Forex traders should sell any rallies with the upside potential reduced to its resistance zone between 74.628 and 74.962.
USD/INR Technical Trading Set-Up - Reduced Breakout Scenario
Long Entry @ 74.400
Take Profit @ 74.750
Stop Loss @ 74.200
Upside Potential: 3,500 pips
Downside Risk: 2,000 pips
Risk/Reward Ratio: 1.75

