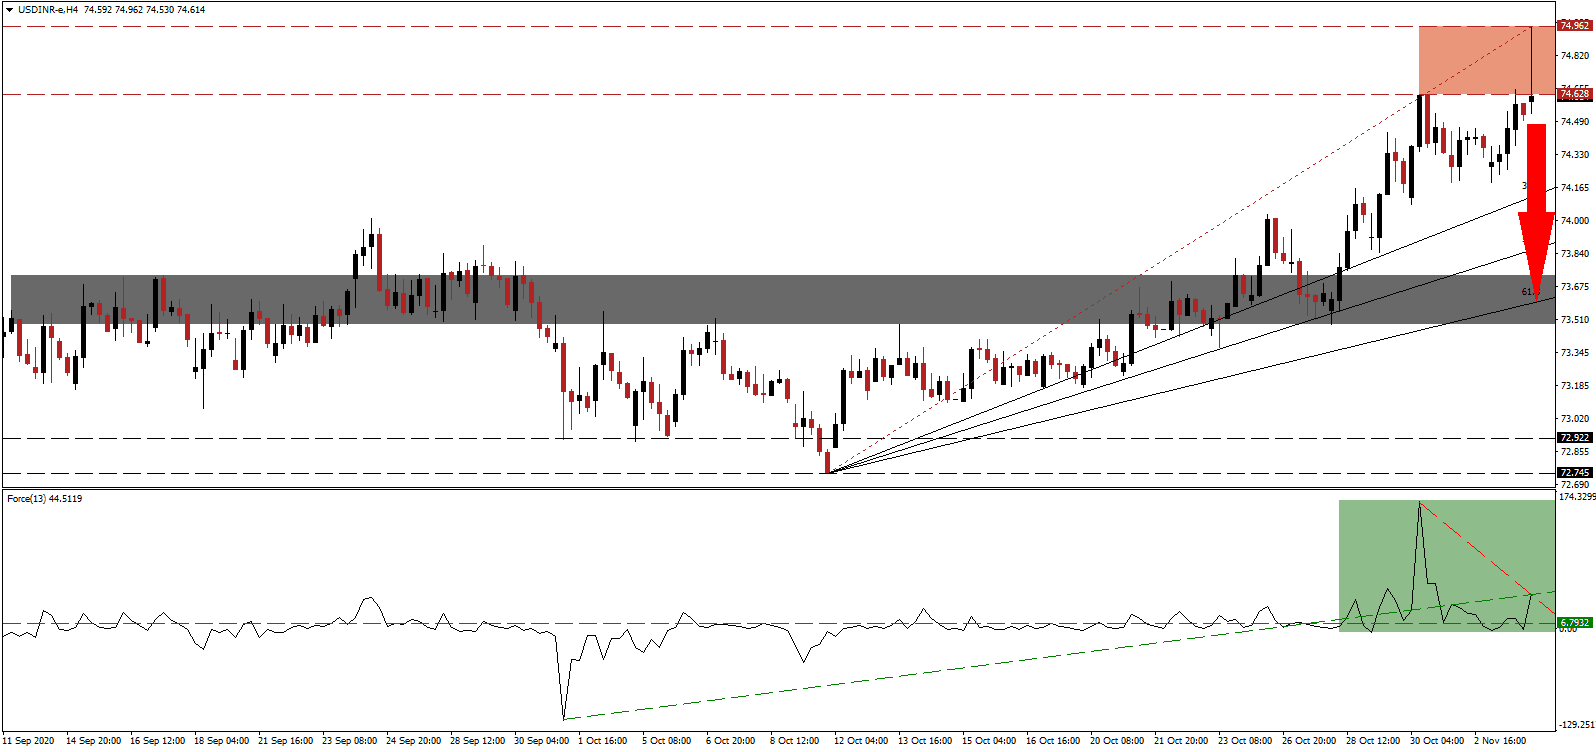
remains the second-most infected country with COVID-19 globally and the third-highest with active cases and the total death toll. Tarun Bajaj, the Economic Affairs Secretary of India, confirmed that the recovery from the pandemic lows continues, pointing towards the 13.0% increase in foreign direct investment (FDI) between April and August of this year. The USD/INR experienced a volatility spike as vote counting in the 2020 US election continues. The breakdown below its resistance zone is likely to spark more downside. While former Vice President Biden took an early lead, President Trump is leading in key battleground states and well-positioned to secure a second four-year term.
The Force Index, a next-generation technical indicator, provided an early warning signal via the emergence of a negative divergence that the next move could be a significant sell-off. Despite the price spike, the Force Index remains below its ascending support level but above its horizontal support level. The steep descending resistance level adds to downside pressure, as marked by the green rectangle. This technical indicator is vulnerable to a collapse below the 0 center-line, placing bears in complete control over the USD/INR.
October exports dropped by 5.4% to $24.80 billion, and imports plunged by 11.6% to $33.6 billion, resulting in a trade deficit of $8.8 billion. Between April and October, Indian exports are down by 19.1% to $150.1 billion, and imports are off by 36.3% to $182.3 billion. Oil imports lead the severe contraction, suggesting sluggish domestic demand. Today’s trade data reveals more challenges ahead for Prime Minister Narendra Modi. Following the breakdown in the USD/INR below its resistance zone located between 74.628 and 74.962, as marked by the red rectangle, US Dollar weakness can lead to more severe selling.
A new report by Home Credit India showed that 46% of Indians relied on debt to manage their households during the height of the Covid-19 pandemic. On a positive note, 50% of respondents confirmed they repaid the loans in full once their economic situation improved. E-way bills for October totaled 64.1 million, a record since the launch of the system, offering cautious optimism about consumer spending. The USD/INR can correct into its short-term support zone located between 73.484 and 73.729, as identified by the grey rectangle, enforced by its ascending 61.8 Fibonacci Retracement Fan Support Level.
USD/INR Technical Trading Set-Up - Breakdown Extension Scenario
- Short Entry @ 74.625
Take Profit @ 73.625
Stop Loss @ 74.925
Downside Potential: 10,000 pips
Upside Risk: 3,000 pips
Risk/Reward Ratio: 3.33
Should the Force Index eclipse its descending resistance level, the USD/INR could attempt a secondary breakout. Volatility may remain elevated over the next few sessions, but the upside potential is limited to its upward adjusted resistance zone between 75.330 and 75.500. More debt will follow the US election, while the economy is on course to slow. Forex traders should sell any advance from current levels.
USD/INR Technical Trading Set-Up - Limited Breakout Scenario
- Long Entry @ 75.125
Take Profit @ 74.375
Stop Loss @ 74.925
Upside Potential: 3,500 pips
Downside Risk: 2,000 pips
Risk/Reward Ratio: 1.75

