Last Monday’s signals were not triggered, as none of the key levels were reached that day.
Today’s BTC/USD Signals
Risk 0.50% per trade.
Trades must be taken prior to 5pm Tokyo time Tuesday.
Long Trade Idea
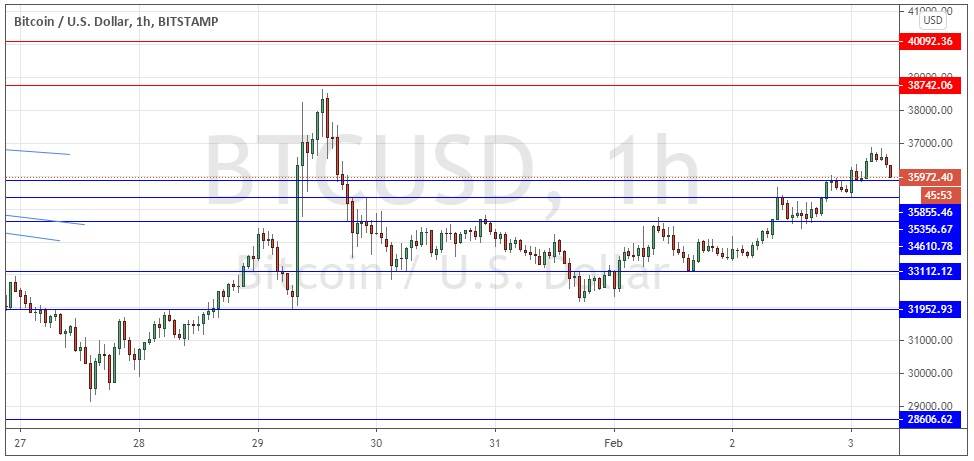
Go long after a bullish price action reversal on the H1 time frame following the next touch of $35,855, $35,357, $34,611, $33,112, or $31,953.
Place the stop loss $100 below the local swing low.
Move the stop loss to break even once the trade is $100 in profit by price.
Take off 50% of the position as profit when the trade is $100 in profit by price and leave the remainder of the position to run.
Short Trade Ideas
Go short after a bearish price action reversal on the H1 time frame following the next touch of $38,742 or $40,092.
Place the stop loss $100 above the local swing high.
Move the stop loss to break even once the trade is $100 in profit by price.
Take off 50% of the position as profit when the trade is $100 in profit by price and leave the remainder of the position to run.
The best method to identify a classic “price action reversal” is for an hourly candle to close, such as a pin bar, a doji, an outside or even just an engulfing candle with a higher close. You can exploit these levels or zones by watching the price action that occurs at the given levels.
BTC/USD Analysis
I wrote last Monday that the technical picture had become more bullish as we had seen the three bearish trend lines which were holding the price down break.
I thought that the price had got established above $32,000, so I thought that Bitcoin looked like a relatively good buy from a bounce at the support level identified at $31,953.
I also saw $35K as a significant hurdle.
I was right about $35K, as the price failed to rise there and made the high of the day in this area before reversing and falling for most of the rest of the day. However, the price never got back to the key support level before turning bullish again.
I was correct to look towards the long side as the price has risen quite impressively over the past few days. It is notable how the recent advance has printed several new “stairstep” support levels, which is a bullish sign.
The price is currently showing a short-term bearish retracement from the $37K area. It remains a buy at the cluster of support levels close below the current chart. If we get two consecutive hourly closes above $37K, then the price will be likely to at least hit the nearest resistance level at $38,742 and possibly get higher than that.
If the price continues to fall and gets established below $35K, that would be a significantly bearish sign, and would be likely to produce some days of consolidation below $35K.
Concerning the USD, there will be a release of the ADP non-farm employment change forecast at 1:15pm London time.

